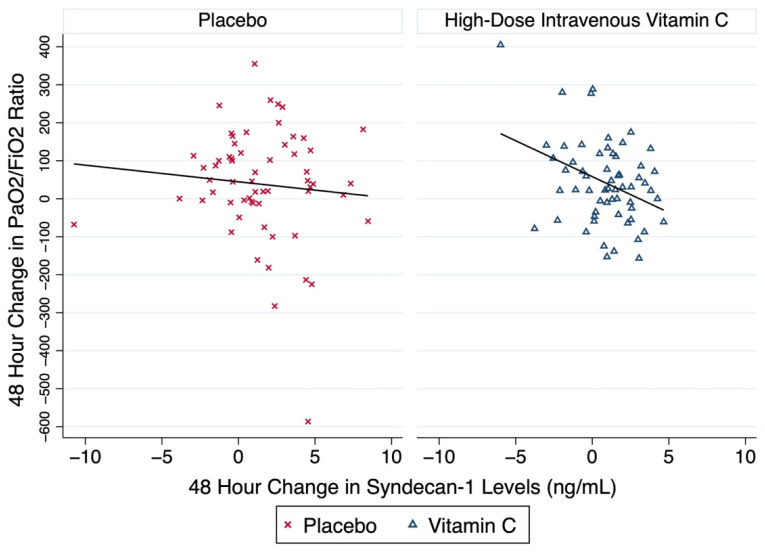
Figure 4.
Scatterplots of the 48 h change in the PaO2/FiO2 ratio and the change in the plasma syndecan-1 during the same time-period. The figure illustrates the change of the PaO2/FiO2 ratio, a marker of oxygenation and lung injury which corresponds to the change in the plasma biomarker syndecan-1 among the two groups, Placebo and HDIVC. The linear fitted line corresponds to the regression line for each group: Placebo and HDIVC, respectively. The subjects of the placebo group are represented with red x symbols, and the subjects of the HDIVC group are represented with blue triangles. Abbreviations: FiO2, fraction of inspired oxygen; HDIVC, high-dose intravenous vitamin C; PaO2, arterial oxygen pressure.

