FIGURE 2.

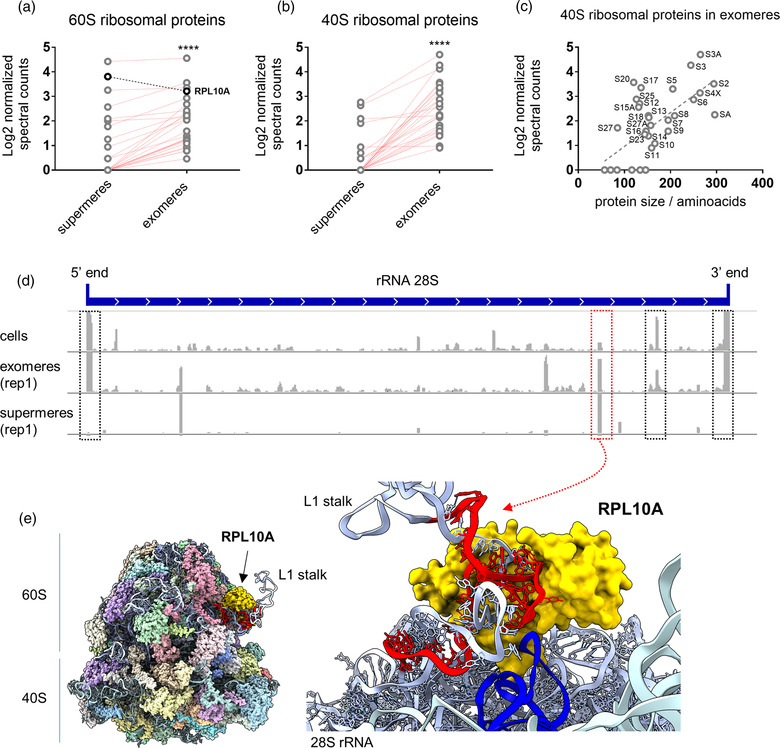
Analysis of ribosomal proteins and rRNA‐derived fragments in supermeres and exomeres. (a,b) Comparison of Log2‐transformed normalised spectral counts of 60S (a) and 40S (b) ribosomal proteins in supermeres and exomeres. Values correspond to the average of three replicates. Red lines: proteins producing a larger number of normalised spectral counts in exomeres than in supermeres. As a group, ribosomal proteins were more abundant in exomeres than in supermeres (Wilcoxon matched‐pairs signed rank test). **** p < 0.0001. (c) Correlation between normalised spectral counts for 40S ribosomal proteins and protein size in amino acids. (d) Sequence coverage plots for the entire 28S rRNA (in 5′‐3′ orientation) in cells, exomeres and supermeres (replicate 1 for each). Black boxes: regions showing high coverage in cells and exomeres, but not in supermeres. Red box: region producing a rRNA‐derived fragment highly enriched in supermeres. (e) Cryo‐EM structure of the human ribosome (PDB: 4UG0), showing RPL10A in gold and the 28S rRNA‐derived fragment that is highly enriched in supermeres (red box in d) in red. Inset: close‐up view of the interaction between this sequence and RPL10A. All other ribosomal proteins were hidden. Blue: tRNA placed on the ribosomal E‐site
