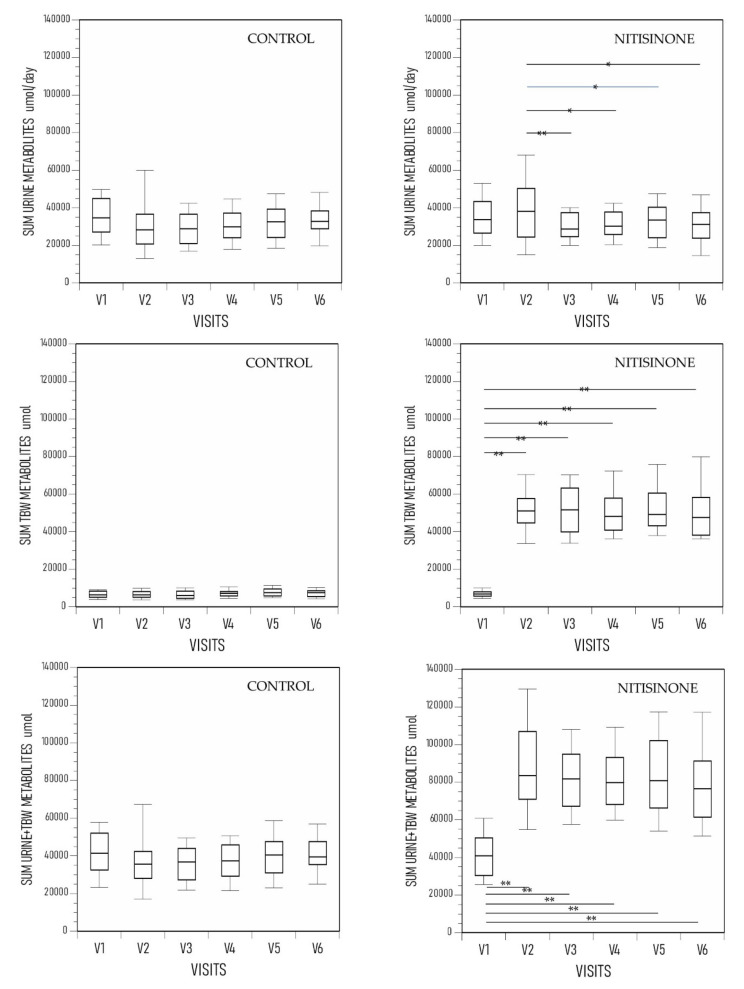
Figure 1.
The SUM URINE METAB, SUM TBW METAB and SUM METAB in the control and the nitisinone group of the SONIA 2. (p values only indicated for between-visit comparisons where statistical significance was achieved.) The visits range from V1 (baseline), V2 (month 3), V3 (month 12), V4 (month 24), V5 (month 36) to V6 (month 48) (data shown as boxplots with median) (statistical significance p expressed * <0.05, ** <0.01, and *** <0.001 respectively).

