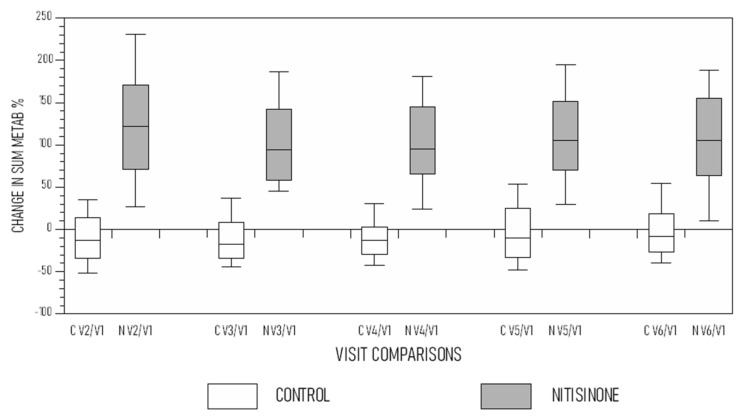
Figure 2.
Comparison of change in METAB (%) at V2–V6 compared with V1 ([(V2−V1/V1) × 100] showing stable mostly neutral values in the control group and significantly higher values in the nitisinone group (C V2/V1 refers to comparison of SUM METAB at V2 vs. V1, and so on for other visits along the X-axis) (data shown as boxplots with median).

