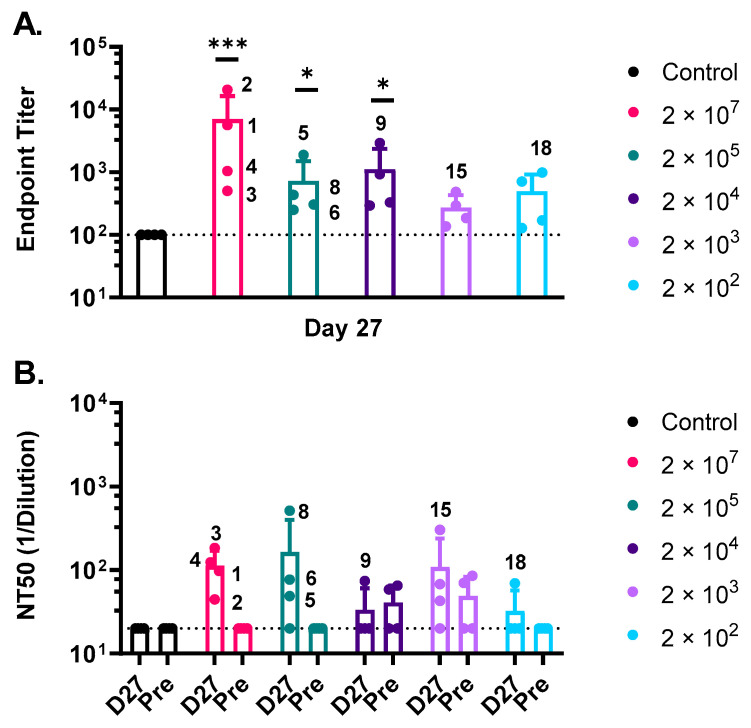
Figure 3.
Characterization of the antibody response to vaccination. (A) ELISA was performed using plates coated with a soluble form of MARV GP Angola. Day 27 post-vaccination endpoint titers plotted as mean and standard deviation with animal numbers corresponding to high responders are shown in the graph. Vaccine dose in PFUs is included at the right side of the graph. The dashed line represents the lower detection limit of assay of 100. Statistical analysis was performed comparing vaccine cohort responses to vector control vaccinated animals using an ANOVA multiple comparison (n = 4, * p ≤ 0.05, *** p ≤ 0.001). (B) Serum dilution of pre-immune (Pre) and Day 27 (D27) post-vaccination at which rVSV∆G-MARV-GP (Musoke) plaque numbers were reduced by 50% (Neutralization titer 50 or NT 50) is plotted. The dashed line represents the lower detection limit of assay, 20. N = 4, mean and standard deviation.

