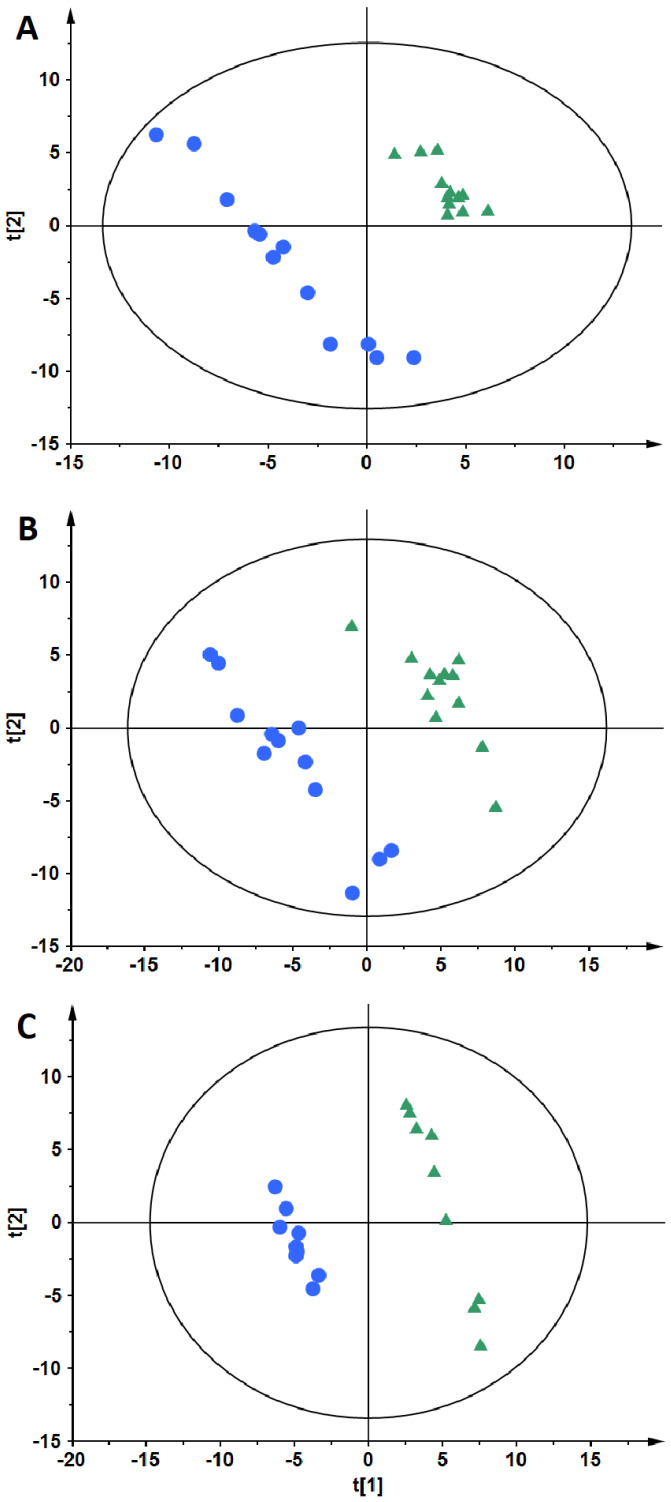
Figure 3.
PLS-DA models based on postprandial AUCs for plasma metabolites obtained after HC meal intake (A,B) and NC meal intake (C). The OW/OB group is represented by blue circles and the NW group by green triangles. Each panel shows results obtained for different data sets: panel A: ESI(–), panels B and C: ESI(+).

