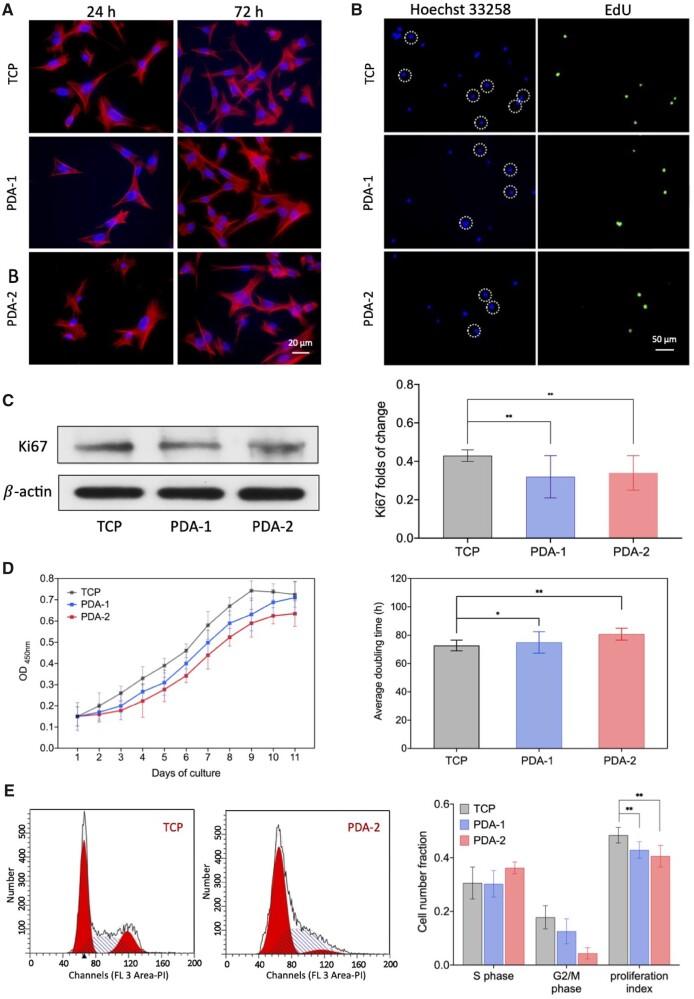
Figure 4.
Examination of cell proliferation to reveal the slowing of proliferation of cells on PDA-modified surfaces. (A) Fluorescence micrographs of hMSCs on TCPs with or without PDA coating. After cultured for 24 and 72 h, the cells were stained with phalloidin to show F-actin (red) and with DAPI to show nuclei (blue). (B) Fluorescence micrographs of the nuclei of the cells on TCP and PDA-coated TCPs. Cells that were synthesizing DNA incorporated EdU into DNA strands (green). The cell nuclei were stained with Hoechst 33258 (blue). (C) Western blot of Ki67. For each group, n = 5. (D) Growth curve of cells on TCPs with and without PDA coating, and the doubling times for each group calculated from total cell viabilities during the 9 days of culture. For each group, n = 5. (E) Flow cytometry analysis and proliferous index statistics. The proliferation index is defined as the proportion of cells in S phase and G2/M phase to the total number of cells. For each group, n = 5. Data are presented as mean ± standard deviation and analyzed by one-way ANOVA. Significant differences are marked with one asterisk (P < 0.05) and double asterisks (P < 0.01).

