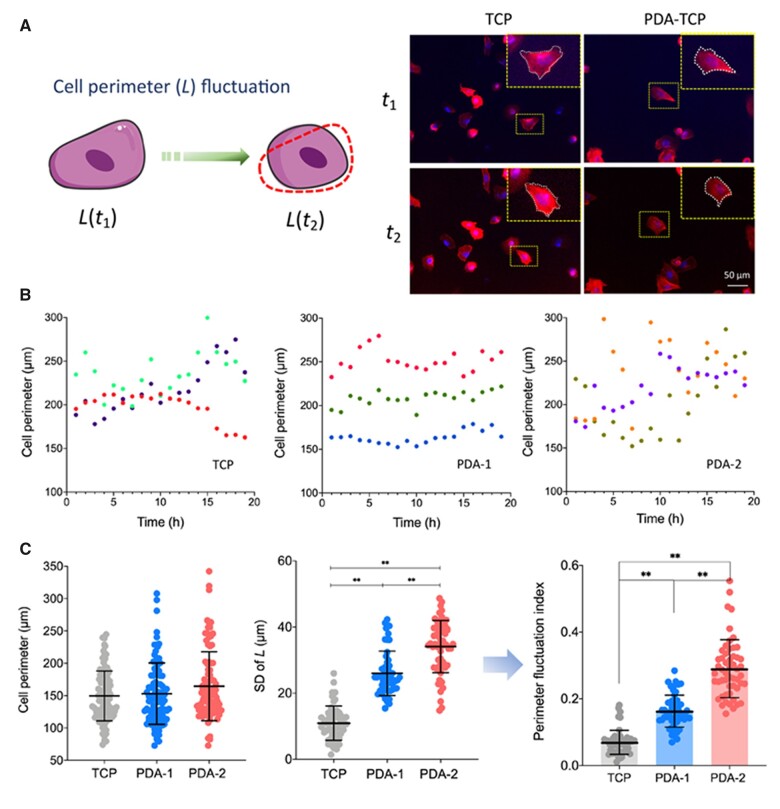
Figure 6.
Local motility of hMSCs on virgin TCPs and PDA-coated TCPs. (A) Schematic graph of cell motility analysis via cell perimeter fluctuation and typical fluorescence micrographs from a live-cell time-lapse imaging system. (B) Demonstration of recorded fluctuation of cell perimeter with time (randomly selected three cells to show). (C) Distribution of cell perimeter, standard deviation (SD) and cell motility fluctuation index, which was defined as the ratio of the standard deviation of cell perimeter L to the corresponding average perimeter. For each group, n = 95. Data are presented as mean ± standard deviation and analyzed by one-way ANOVA. Significant differences are marked with one asterisk (P < 0.05) and double asterisks (P < 0.01).

