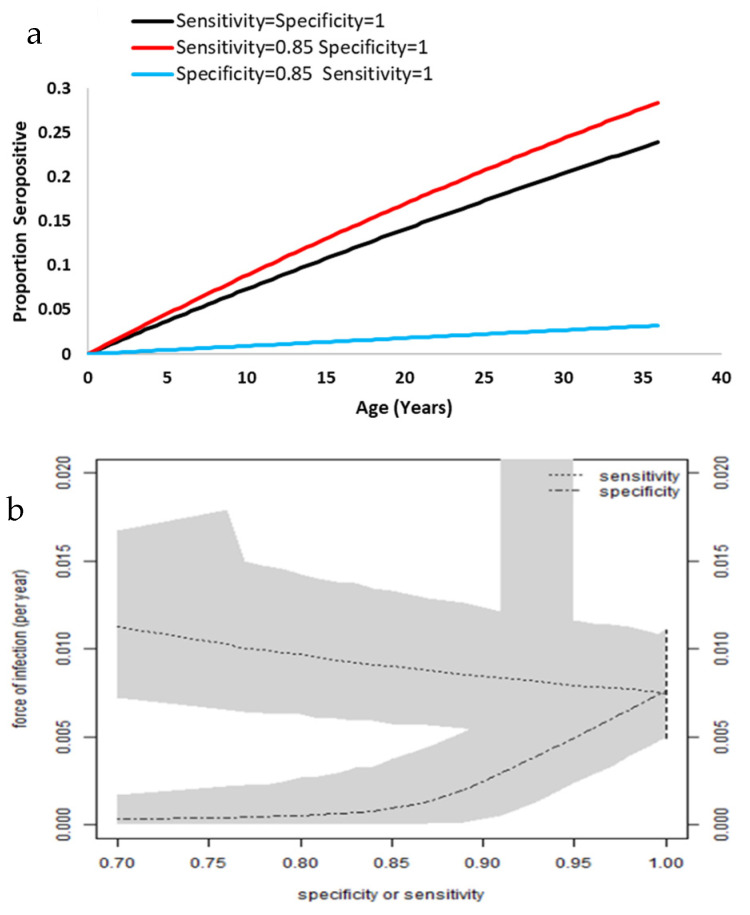
Figure 2.
Representation of seropositivity by age and the force of infection. (a) Proportion of seropositive patients by age. (b) Relation between force of infection, sensitivity, and specificity. The grey zones represent the 95% credible intervals. As the credible intervals approach the 95% confidence interval (vertical dashed line), the sensitivity and specificity approach 100%.

