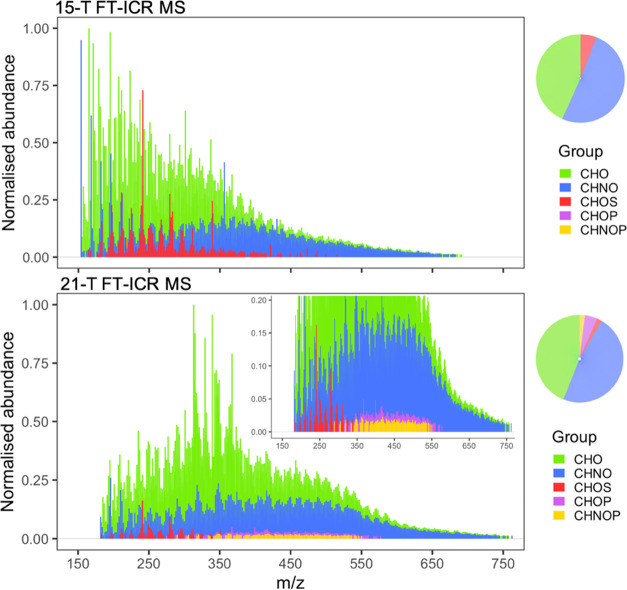
Figure 1.
Reconstructed mass spectra of organic aerosols from (−)ESI analysis with 15-T and 21-T FT-ICR mass spectrometers. A vertical expansion of the latter spectrum is presented in the inset to aid the visualization of the low-abundance CHOP and CHNOP peaks. Peaks are colored by the molecular group of the formula assigned to them.

