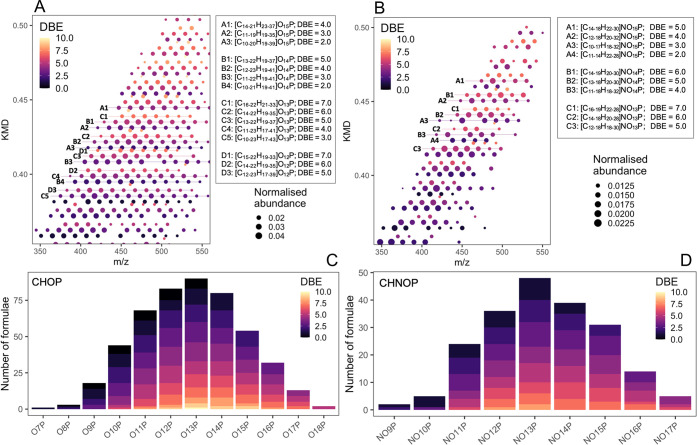
Figure 3.
Molecular characteristics and classes of CHOP and CHNOP formulae detected in the organic aerosol sample. (A, B) Zoomed-in Kendrick mass defect plot with CH2 as the base, where data points are colored by double bond equivalence. Elemental compositions of representative CH2-homologous series are elaborated in the adjacent table. The number and length of all homologous series formed by the CHOP and CHNOP species are drawn in Figure S7. (C, D) Frequency of occurrence of formulae in P-containing heteroatomic classes, OoP and NOoP.

