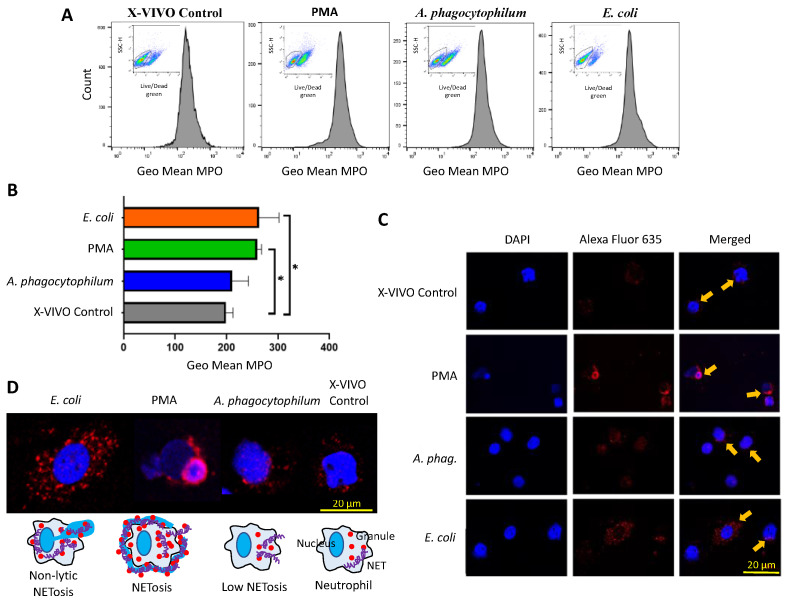
Figure 3.
MPO levels in differentiated HL60 cells. (A) Live/dead cells were differentiated and quantified in all treatments using a fixable Green Dead cell stain Kit (Molecular Probes, Eugene, OR, USA). Then, live cells were gated to evaluate MPO expression only in these cells. Live cells were detected in the four different treatments. High resolution images are displayed in Supplementary Figure S4. (B) The MPO levels were quantified, and the geometric mean (Geo Mean) compared between groups by one-way ANOVA test (* p < 0.05; n = 4 biological replicates). (C) Representative images of immunofluorescence analysis of cells treated with X-VIVO control, PMA, A. phagocytophilum, and E. coli. Cells were stained with rabbit anti-MPO antibodies and conjugated with fluorescently labeled Alexa Fluor 635 goat anti-rabbit IgG secondary antibody (MPO in red, arrows) and labeled with DAPI (DNA in blue). (D) Representative images of immunofluorescence analysis and proposed associated models of induced NETosis.

