Figure 6.

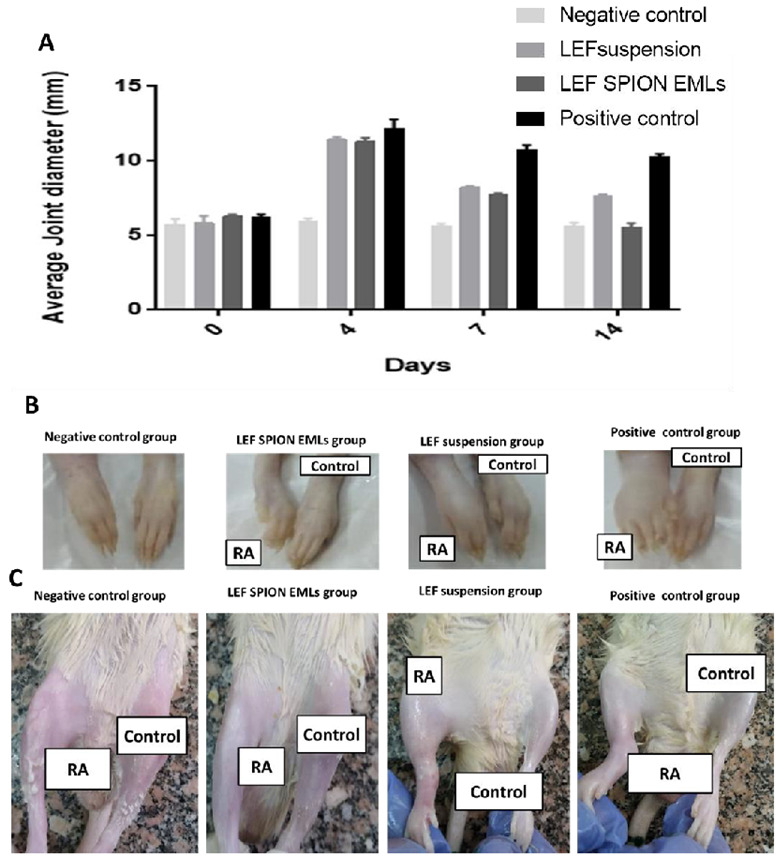
(A) Average joint diameter of different experimental groups at days 0, 3, 7, and 14. (B) and (C) are photographs of different groups of rat paws and joints 14 days post-treatment, respectively.

(A) Average joint diameter of different experimental groups at days 0, 3, 7, and 14. (B) and (C) are photographs of different groups of rat paws and joints 14 days post-treatment, respectively.