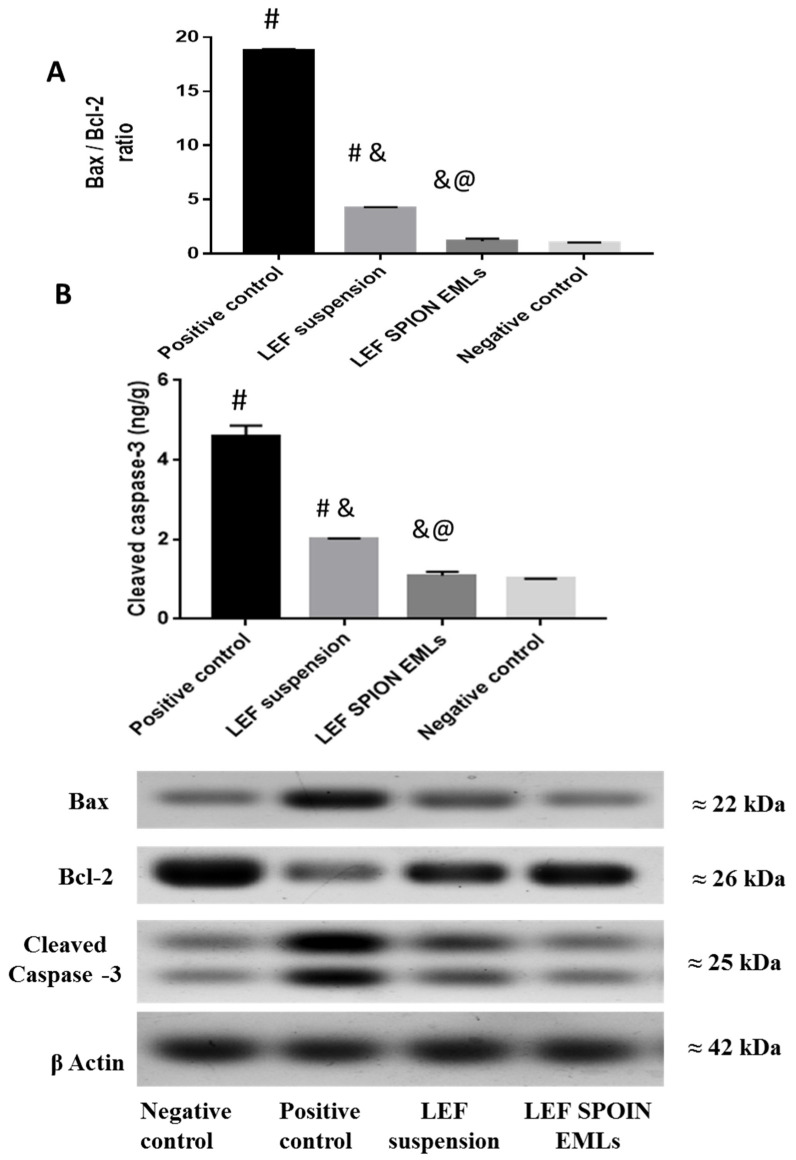
Figure 9.
Effect of LEF suspension and LEF SPION EMLs on Bax and Bcl-2 ratio (A) and cleaved caspase-3 level (B) in joints of different experimental groups. Values are expressed as mean ± SD; n = 3. Statistical analyses were performed using one-way analysis of variance (ANOVA) followed by Tukey’s post hoc test. # significant as compared to negative control group. & significant as compared to positive control group. @ significant as compared to LEF suspension. Significant difference was conducted at p < 0.0001.

