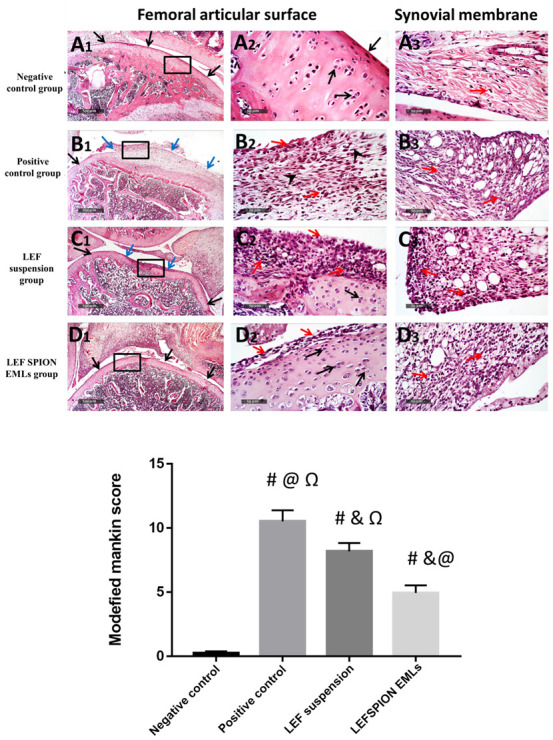
Figure 11.

Morphological features of articular surfaces and synovial membranes from different groups: (A1–A3) negative control group, (B1–B3) positive control group, (C1–C3) LEF suspension group, and (D1–D3) LEF SPION EMLs group. H&E stain 40× & 400×. Black arrow = apparent intact cartilage, blue arrow = damaged cartilaginous surfaces, red arrow = inflammatory cells infiltrates, arrow head = fibroblastic proliferation. Values are expressed as mean ± SD; n = 6. Statistical analyses were performed using one-way analysis of variance (ANOVA) followed by Tukey’s post hoc test. # significant as compared to negative control group. & significant as compared to positive control group. @ significant as compared to LEF suspension. Ω significant as compared to LEF-SPION EMLs. Significant difference was conducted by one-way ANOVA at p < 0.0001.
