Figure 2.

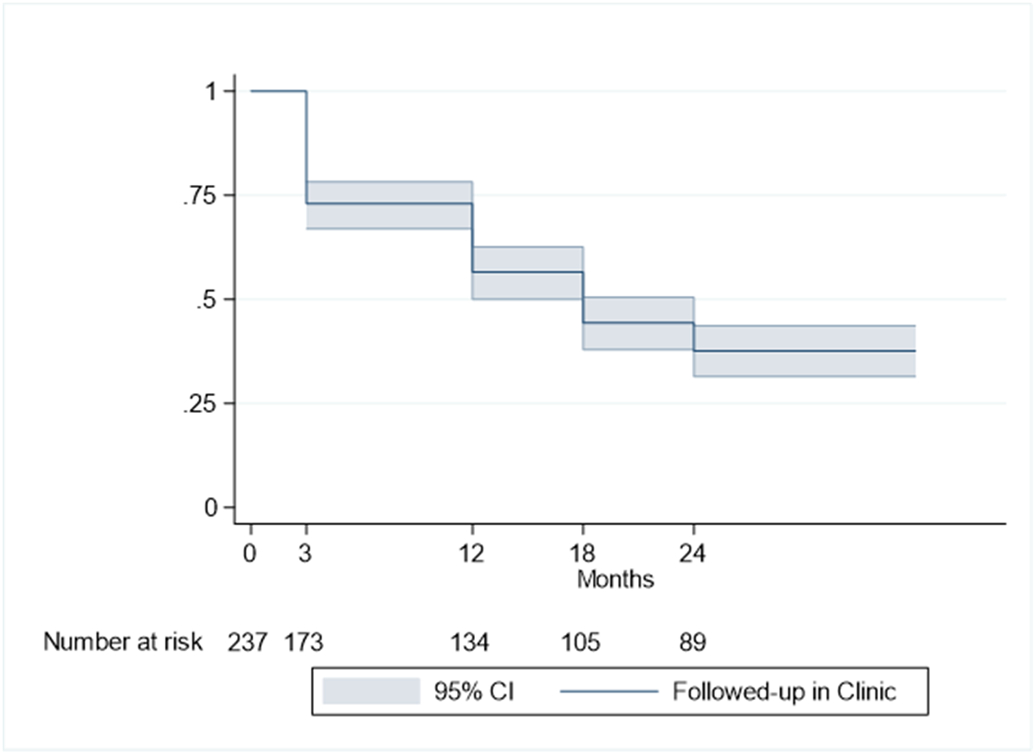
Kaplan-Meier survival curve of proportion of neonatal follow-up attendance over a 2-year period. X-axis represents month of scheduled follow-up and Y-axis represents proportion of follow-up attendance.

Kaplan-Meier survival curve of proportion of neonatal follow-up attendance over a 2-year period. X-axis represents month of scheduled follow-up and Y-axis represents proportion of follow-up attendance.