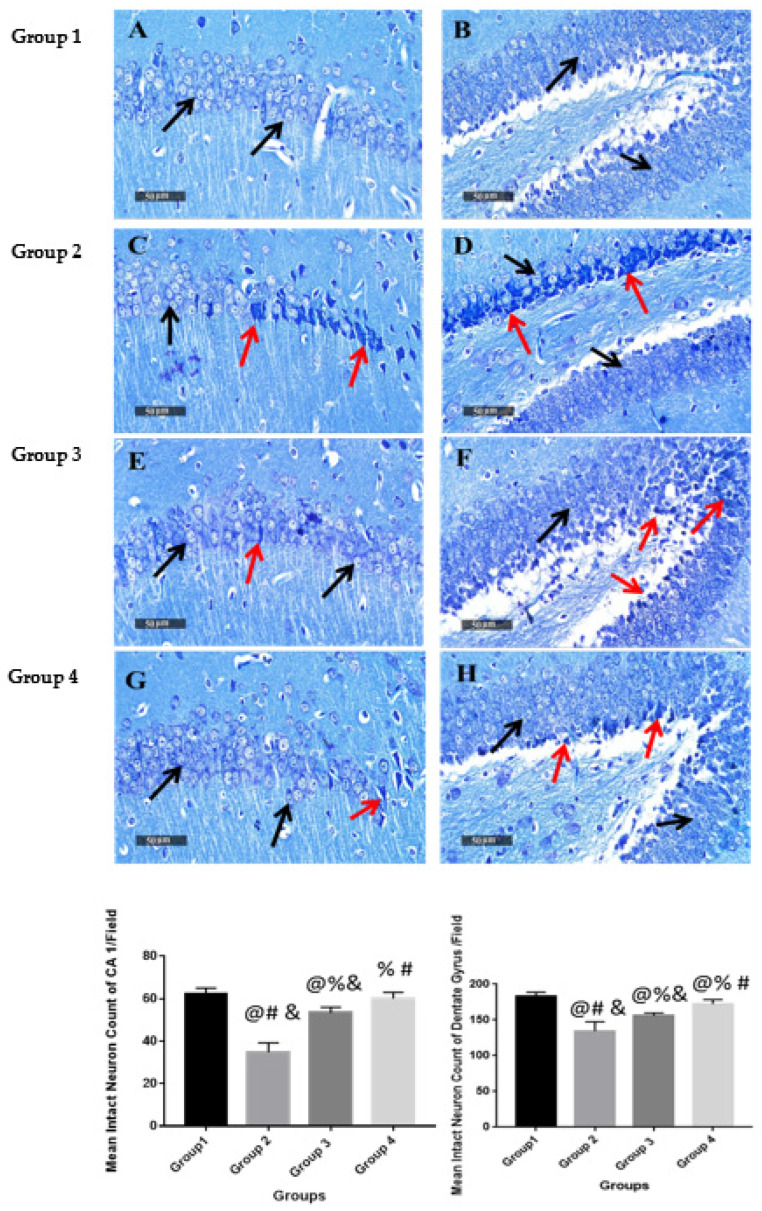
Figure 7.
Light-microscopic examination of toluidine blue-stained pyramidal neurons in CA1 & Dentate Gyrus hippocampal sub regions in different groups with mean intact neuronal counts, 400X. Data were represented as mean ± SD (n = 6), black arrows = intact neurons, red arrows = damaged neurons. (A) and (B) represent group1 (negative control). (C) and (D) represent group 2 (Positive control). (E) and (F) represent group 3 (ART). (G) and (H) represent group 4 (F3). Statistical analyses were performed using one-way analysis of variance (ANOVA) followed by Tukey’s post hoc test. @ Significant as compared to negative control (group 1). % Significant as compared to positive control group (group 2). # Significant as compared to ART (group 3). & Significant as compared to ART formulation (group 4). Significant difference was conducted by one-way ANOVA at p < 0.0001.

