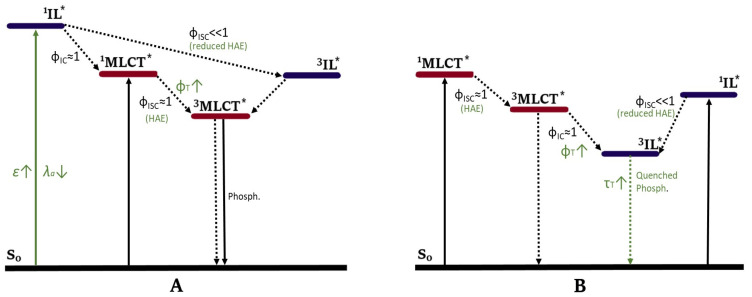
Figure 8.
Energy level diagrams describing the photophysical processes of TM PSs with a visible light-harvesting ligand [25]. (A) Energy diagram for attaining strong absorption in the visible range. E(3IL) > E(3MLCT) [93] (B) Energy diagram for attaining a long-lived 3IL state. E(3IL) < E(3MLCT) [94]. For both diagrams the transition 1MLCT → 3MLCT is more efficient due to the HAE and the transition 1IL → 3IL is less efficient due to a reduced HAE. The excited state is denoted by a *.

