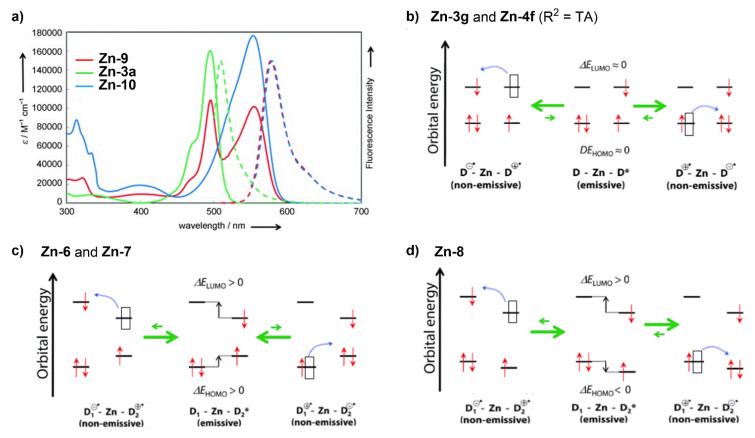
Figure 18.
(a) Absorption spectra (solid lines) and emission spectra (dotted lines) of the heteroleptic complex Zn-6 an its homoleptic analogues Zn-3g and Zn-4f (R2 = TA) in toluene. Schematic illustrations of the energy levels and electron transfer processes (blue arrows) in polar solvents for (b) homoleptic complexes Zn-3g and Zn-4f (R2 = TA) (c) Zn-6 and Zn-7, and (d) Zn-8. Reproduced with permission from [165]. Copyright © 2012 John Wiley & Sons.

