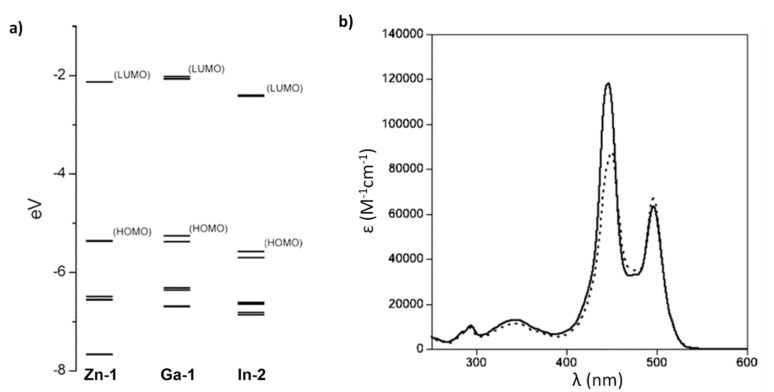
Figure 31.
(a) Energy level diagrams of Ga-1, In-2 and Zn-1 obtained with DFT calculations. (b) UV-Vis absorption spectra of Ga-2 (dotted line) and In-3 (solid line) in hexanes. Reproduced with permission from [3]. Copyright © 2006 American Chemical Society.

