. 2022 May 6;3(4):316–329. doi: 10.1158/2643-3230.BCD-21-0128

Figure 5.

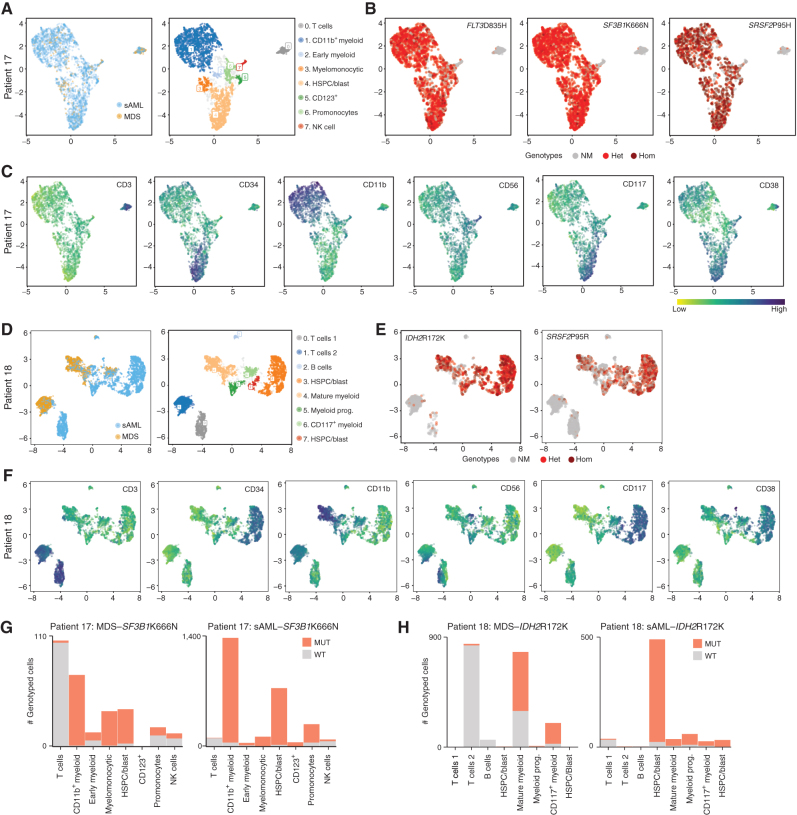
Figure 5. Combined protein and DNA analysis reveals mutational identities of both myeloid and lymphoid lineages. A, UMAP embeddings (patient 17) mapped on cell-surface marker levels colored by samples or by HDBSCAN clusters. Clusters were identified by immunophenotype and named for cell type by immunophenotype. B, Genotypes are shown for each mapped cell (only cells for which each genotype was known). Code for each variant is no mutation (NM), heterozygous (Het), or homozygous (Hom). C, Surface-marker expression of major markers used to define cell type. D–F, Similar to A–C, but with patient 18. G and H, Cell cluster–based analysis of the proportion of mutated cells MDS to sAML for SF3B1 (patient 17) or IDH2 (patient 18).

Combined protein and DNA analysis reveals mutational identities of both myeloid and lymphoid lineages. A, UMAP embeddings (patient 17) mapped on cell-surface marker levels colored by samples or by HDBSCAN clusters. Clusters were identified by immunophenotype and named for cell type by immunophenotype. B, Genotypes are shown for each mapped cell (only cells for which each genotype was known). Code for each variant is no mutation (NM), heterozygous (Het), or homozygous (Hom). C, Surface-marker expression of major markers used to define cell type. D–F, Similar to A–C, but with patient 18. G and H, Cell cluster–based analysis of the proportion of mutated cells MDS to sAML for SF3B1 (patient 17) or IDH2 (patient 18).