. 2022 May 6;3(4):316–329. doi: 10.1158/2643-3230.BCD-21-0128

Figure 6.

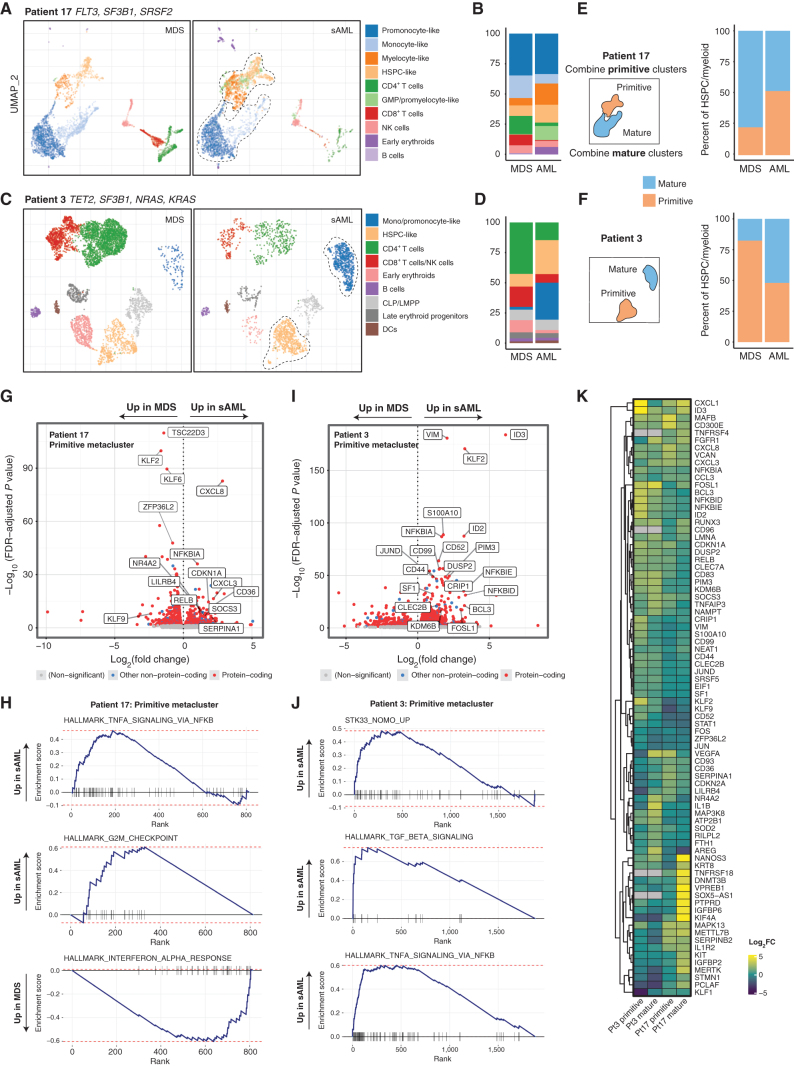
Figure 6. Single-cell RNA-seq of longitudinal samples identify transcriptional gene sets that accompany disease progression. A, Gene expression-derived UMAP embedding of all cells from scRNA-seq of two samples from patient 17, clustered with HDBSCAN and then labeled by cell type according to transcriptional signature. The dotted line encapsulates primitive and mature cells (for E, F). B, Number of cells per cluster shown and change from MDS to sAML. C and D, UMAP and cluster distribution for patient 3 as in A–B. E and F, Cells mapped from each time point and patient separately with a depiction of the creation of metaclusters that are either labeled primitive or mature. G, Differentially expressed genes for primitive metacluster for patient 17, with selected top significant genes labeled. H, GSEA plots for patient 17 primitive metacluster. I, Differentially expressed genes for patient 3 primitive metacluster. J, Patient 3 GSEA plots for primitive metacluster. K, Heatmap depicting differentially expressed genes across all metaclusters with heat based on log2 fold change increase.

scRNA-seq of longitudinal samples identify transcriptional gene sets that accompany disease progression. A, Gene expression-derived UMAP embedding of all cells from scRNA-seq of two samples from patient 17, clustered with HDBSCAN and then labeled by cell type according to transcriptional signature. The dotted line encapsulates primitive and mature cells (for E, F). B, Number of cells per cluster shown and change from MDS to sAML. C and D, UMAP and cluster distribution for patient 3 as in A–B. E and F, Cells mapped from each time point and patient separately with a depiction of the creation of metaclusters that are either labeled primitive or mature. G, Differentially expressed genes for primitive metacluster for patient 17, with selected top significant genes labeled. H, GSEA plots for patient 17 primitive metacluster. I, Differentially expressed genes for patient 3 primitive metacluster. J, Patient 3 GSEA plots for primitive metacluster. K, Heatmap depicting differentially expressed genes across all metaclusters with heat based on log2 fold change increase.