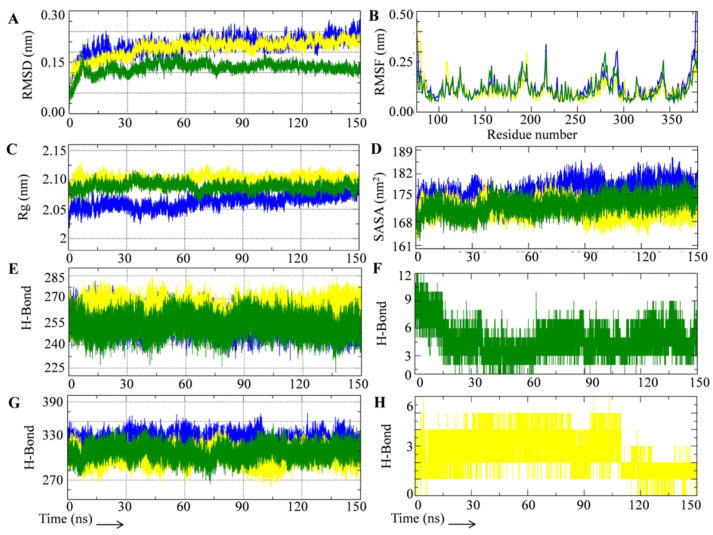
Figure 2.
MD simulation trajectory analysis of test systems during 150 ns simulation period. (A) RMSD plot of UGSC (blue), DGSC (yellow) and RGSC (green). (B) RMSF plot of UGSC (blue), DGSC (yellow) and RGSC (green). (C) Rg plot of UGSC (blue), DGSC (yellow) and RGSC (green). (D) SASA plot of UGSC (blue), DGSC (yellow) and RGSC (green). (E) Average number of intramolecular hydrogen bonds formed in UGSC (blue), DGSC (yellow) and RGSC (green). (F) Average number of hydrogen bonds formed between rutin and GS. (G) Average number of hydrogen bonds formed between GS and surrounding solvent in UGSC (blue), DGSC (yellow) and RGSC (green). (H) Average number of hydrogen bonds formed between DAPT and GS.

