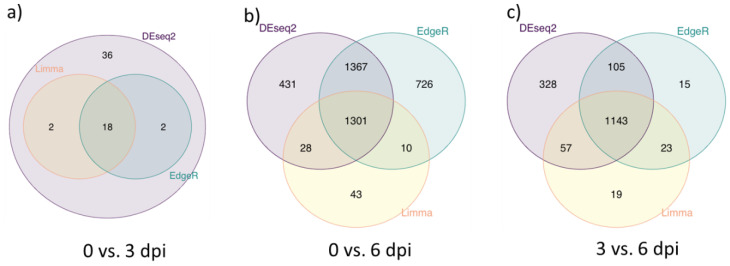
Figure 2.
Differential gene expression analyses across 3 pairwise comparisons using 3 different methods. Venn diagrams of the differentially expressed genes (DEGs) in PBMCs from pigs collected at 0 dpi, 3 dpi and 6 dpi. (a) Venn diagram showing the overlap between the DEGs identified by the DEseq2, glmQL for EdgeR and Limma packages (see Materials and Methods) shown in lilac, blue and yellow, respectively, between PBMCs from the uninfected (0 dpi) and infected pigs at 3 dpi. (b) Venn diagram of the DEGs detected by these same packages between the PBMCs from uninfected pigs (0 dpi) and from infected pigs at 6 dpi. (c) Venn diagram of the DEGs between PBMCs collected from pigs at 3 and 6 dpi.

