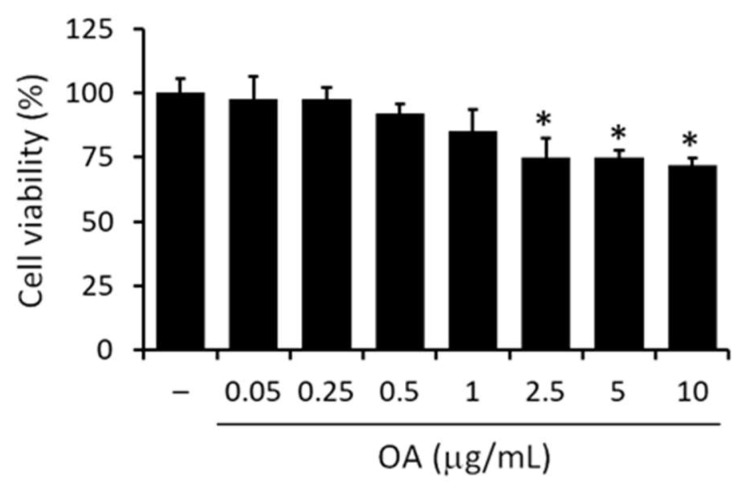
Figure 6.
Effect of OA on RAW 264.7 cell viability. Cells were starved for 6 h and then treated for a further 18 h with doses of OA between 0.05–10 μg/mL. Values are expressed as percentages compared with untreated control cells (−). Data are reported as mean ± SD of three independent experiments. Tukey’s test (n = 3). * p < 0.05 vs. untreated control cells.

