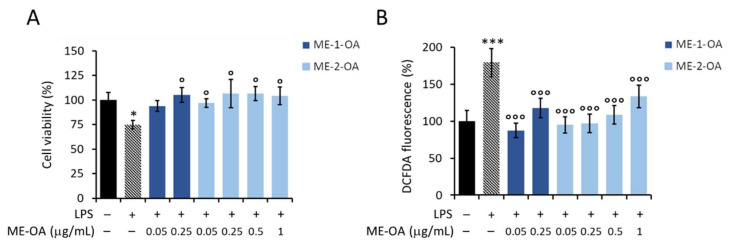
Figure 8.
Effect of OA loaded into ME-1 and ME-2, i.e., ME-1-OA and ME-2-OA, respectively, on LPS-damaging effects in RAW 264.7 cells. (A) MTT assay and (B) detection of intracellular ROS production in cells starved for 6 h and then treated for 18 h with ME-1-OA at 0.05 and 0.25 μg/mL OA loaded (blue bars), and with ME-2-OA at 0.05–1 μg/mL OA loaded (light-blue bars), in the presence of LPS (+). Values are expressed as percentages compared to untreated (−) and LPS-unstimulated (−) control cells. Data are reported as mean ± SD of three independent experiments. Tukey’s test (n = 3). * p < 0.05; *** p < 0.001; vs. untreated and LPS-unstimulated control cells. ° p < 0.05; °°° p < 0.001 vs. untreated but LPS-stimulated control cells.

