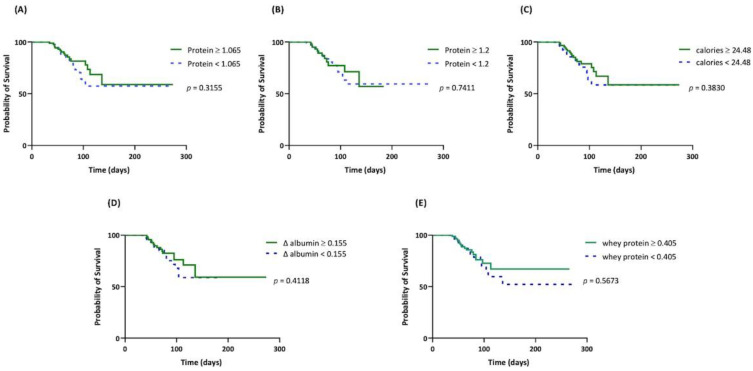
Figure 4.
Kaplan–Meier survival curve of survival outcomes for different nutritional parameters. (A) Daily protein intake, g/kg/day; (B) daily protein intake, g/kg/day; (C) daily calorie intake, kcal/kg/day; (D) Δ albumin, difference between the 4th week and baseline serum albumin levels, g/dL; (E) daily whey protein intake, g/kg/day.

