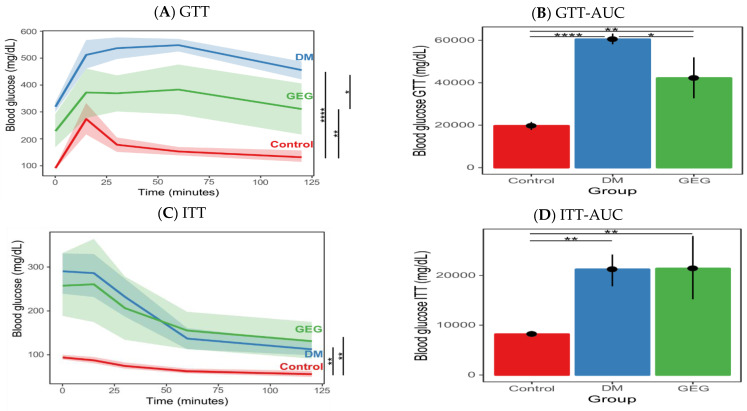
Figure 2.
Effect of gingerol-enriched ginger (GEG) on blood glucose during ipGTT (A), ipGTT AUC (B), blood glucose during ipITT (C), and ipITT AUC (D). Data is presented as mean with error bars or ribbons indicating 90% confidence interval. One-way ANOVA was used, followed by Tukey’s HSD in R environment. n = 6–8 per group. * indicates p < 0.05, ** p < 0.01, and **** p < 0.0001.

