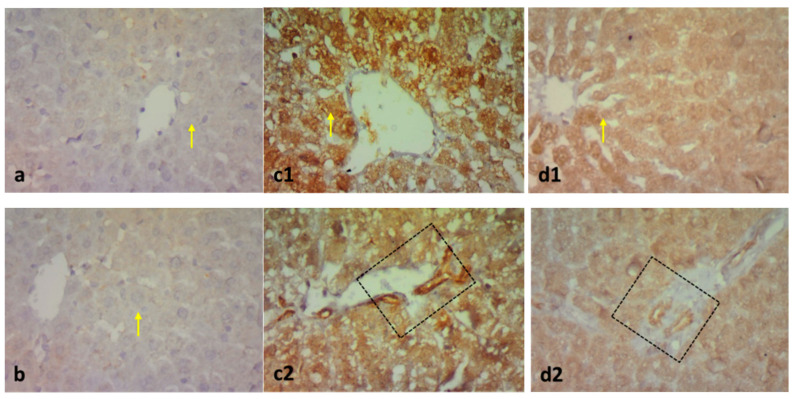
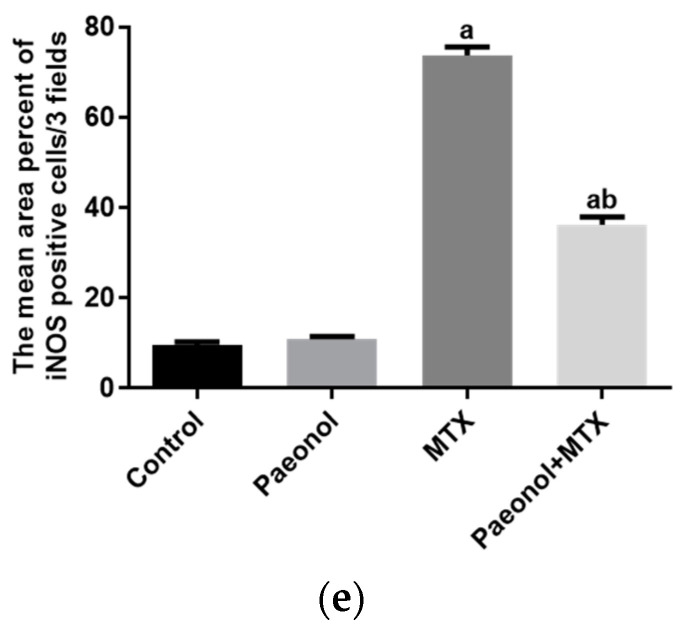
Figure 9.
The immunohistochemical examination of hepatic inducible nitric oxide synthase (iNOS) expression in methotrexate (MTX)-induced hepatotoxicity (×400). The liver tissues of the control (a) and paeonol (b) groups show hepatocytes with faint cytoplasmic iNOS expression (yellow arrows). The liver tissues of the MTX-treated rats show hepatocytes with intense cytoplasmic iNOS expression (yellow arrow) (c1). Expression is also noticed in the portal area (square) (c2). In contrast, the liver tissues of the paeonol + MTX group show hepatocytes with little iNOS expression (yellow arrow) (d1). Little expression is also noticed in the portal area (square) (d2). A semi-quantitative analysis of iNOS positive cells (e). Data are represented as mean ± SEM (n = 6). Letters a,b Denote significant differences from the normal control and the MTX groups, respectively, at p ˂ 0.05.


