Figure 2.

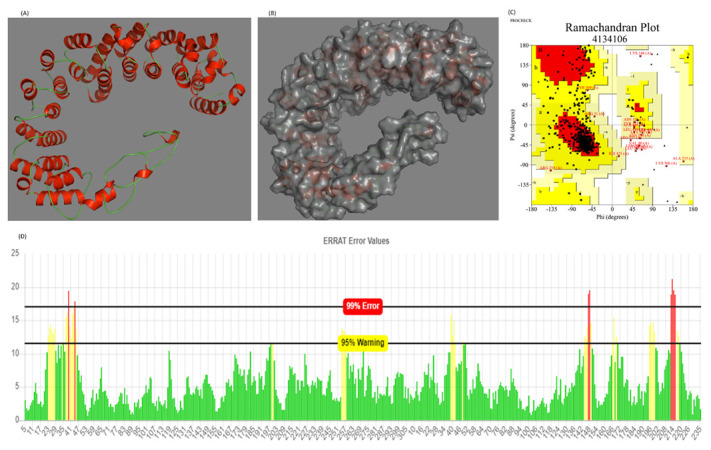
(A,B) Structure of the selected 3D model of the final vaccine construct (cartoon and surface representation, respectively). Red and green represent the helical and loop region, respectively. (C) Ramachandran plot of the predicted model of the designed vaccine using the PROCHECK server (76.3%, 19.6%, 2.6%, and 1.5 in the favored, allowed, outlier, and disallowed regions, respectively). (D) Validation of the overall quality of the predicted model on ERRAT2 analysis (overall quality factor = 91.149).
