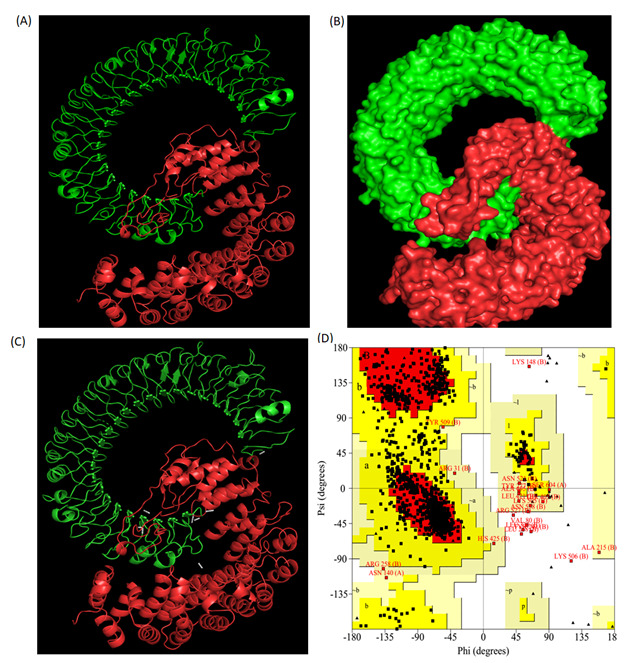
Figure 3.

(A) Cartoon representation and (B) surface view of the structure and interactions of the docking complex (TLR3-designed vaccine). TLR3 is shown in green whereas designed vaccine is shown in red. (C) The dotted lines in white represent the polar interactions between the TLR3 and designed vaccine. (D) Ramachandran plot of the docking complex as revealed by PROCHECK server analysis.
