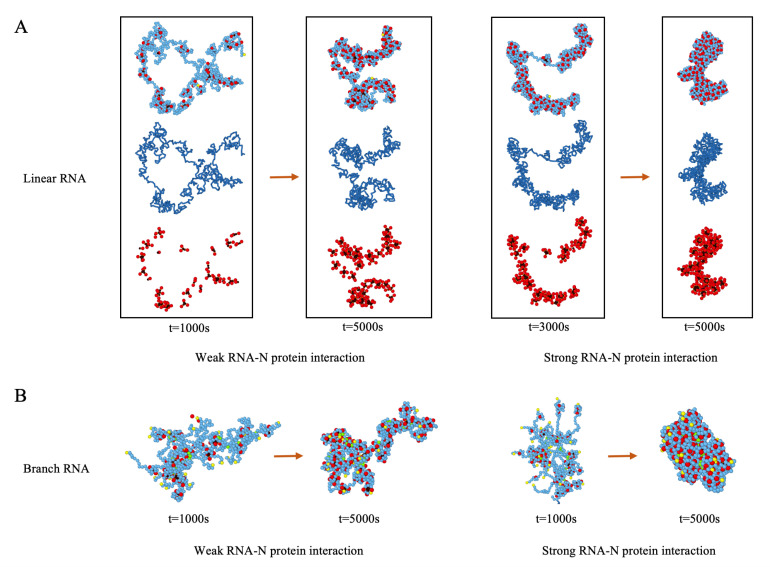
Figure 5.
(A) N proteins condense a linear chain with subunits and form RNP. Both cases of the weak () and strong () RNA–N protein interactions are presented. The N protein concentration is 25. In each window, the upper snapshot shows the RNP with genome in blue and N proteins in red and black. The middle and lower snapshots display the RNA and N protein clusters (NPCs), respectively. Note that, if the distance between the N-terminals of N proteins (black) are less than a cut-off distance, they are considered to belong to the same cluster. (B) N proteins condense RNA. RNA is modeled as a branched polymer with the branch number . Both cases of the weak and strong RNA–N protein interactions are considered. The branched points and end points are colored in green and yellow, respectively. At the weak RNA–N protein interaction, the N proteins aggregate into clusters in the same way as they do in the case of linear chains, regardless of the branching structure of the chain. The situation differs for the case of the strong RNA–N protein interaction, where the N proteins condense along the branches first, which later aggregate to form a compact RNP.

