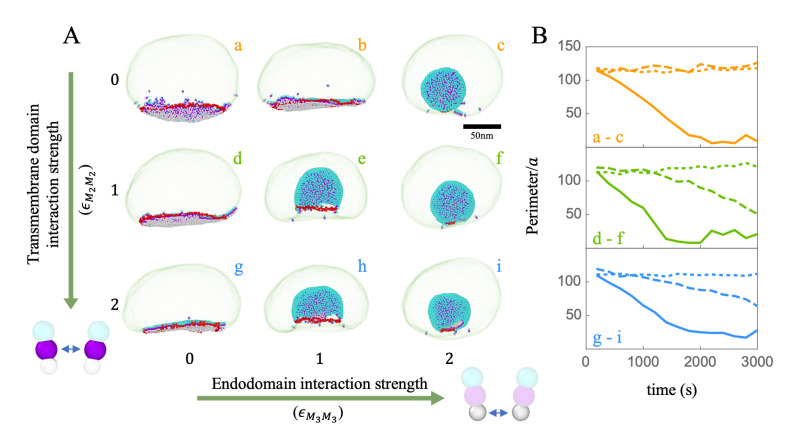
Figure 6.
(A) Snapshots of budding through the ERGIC membrane as a function of the strength of the interaction between the M protein transmembrane domains (y-axis) and between the endodomains (x-axis). The interactions become stronger from top to bottom and from left to right. The lipid–lipid interaction strength is kept constant for all simulations; (B) the perimeters (in the unit of a) of the cap built from the M proteins as a function of time in the budding process. The dotted, dashed, and solid lines correspond to the endodomain interaction strengths = 0 (a, d, g), 1 (b, e, h) and 2 (c, f, i), respectively. As the strength of becomes stronger (the solid line), the budding process becomes faster.

