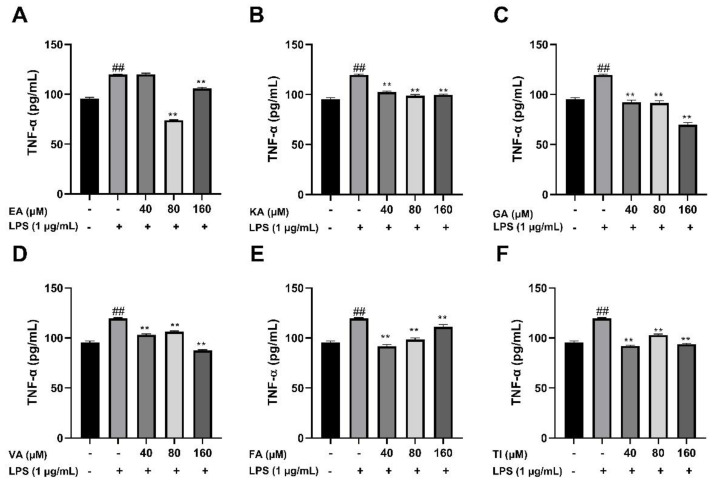
Figure 18.
Effects of Ellagic acid (A: EA), Kaempferol-3-o-rutin glycoside (B: KA), Gallic acid (C: GA), Vanillic acid (D: VA), Ferulic acid (E: FA), and Tiliroside (F: TI) on LPS -induced TNF-α in BV2 cells at high (160 μM), medium (80 μM) and low (40 μM) concentrations. − indicates that contain, + indicates does not contain. ## represent significant difference between the representative model group and the control group. ** represents extremely significant difference compared with model group (p < 0.01).

