
Fig. 2.
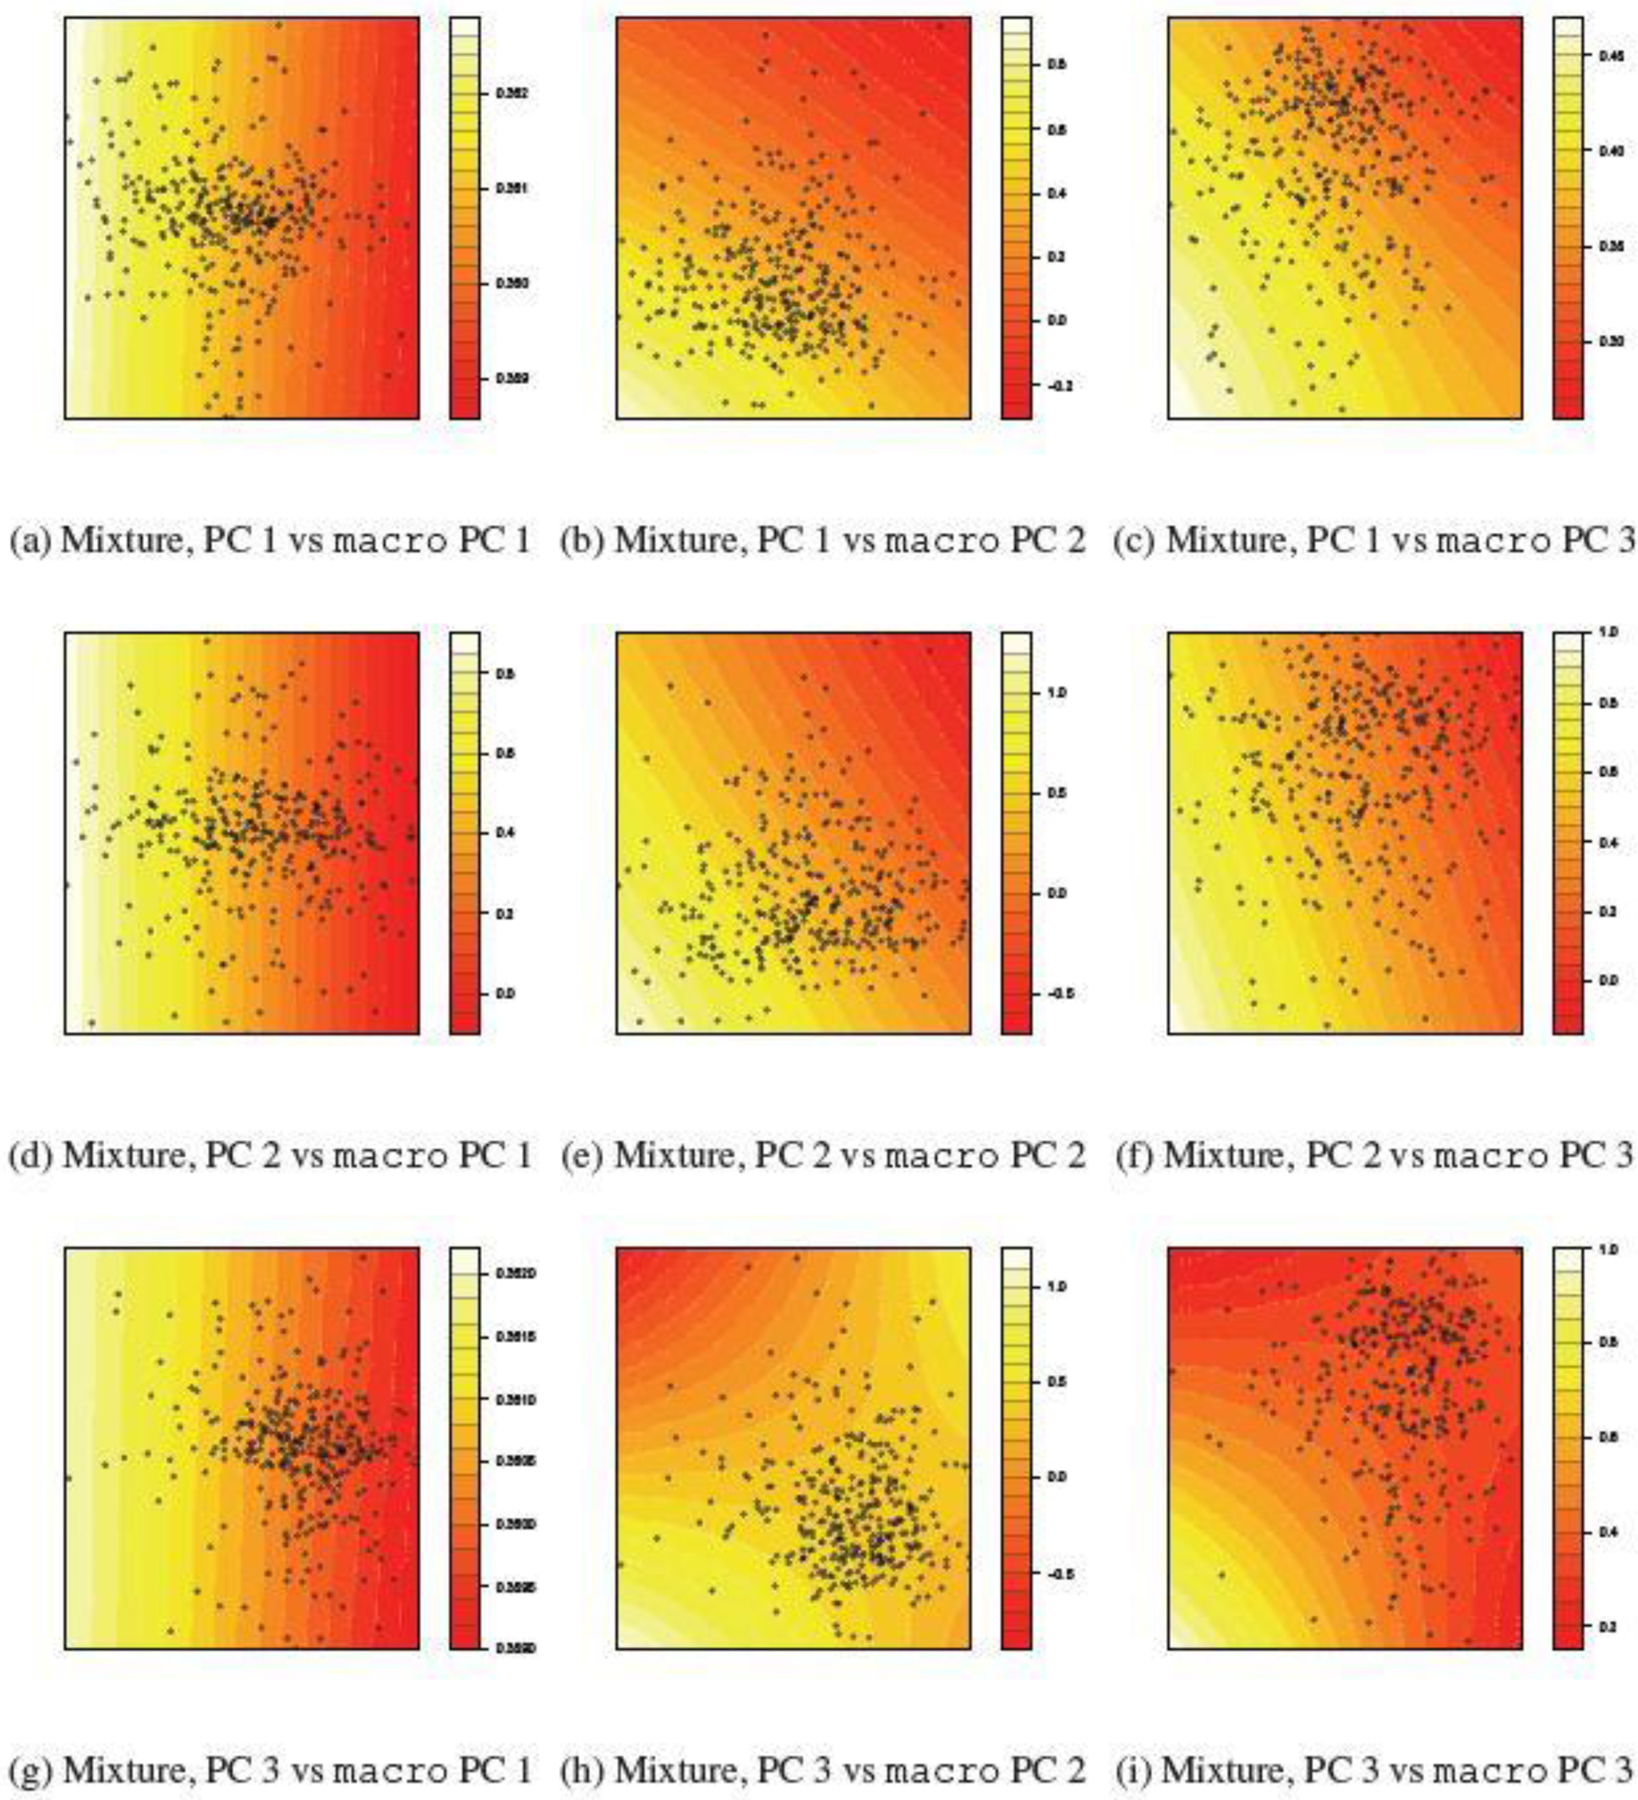
Interaction between joint mixture and macronutrient by principal components The top 3 PCs for pollutants accounts for 42.60%, 37.34%, 20.05% of total variation, The top 3 PCs for macro accounts for 63.54%, 28.46% and 7.36% of total variation.