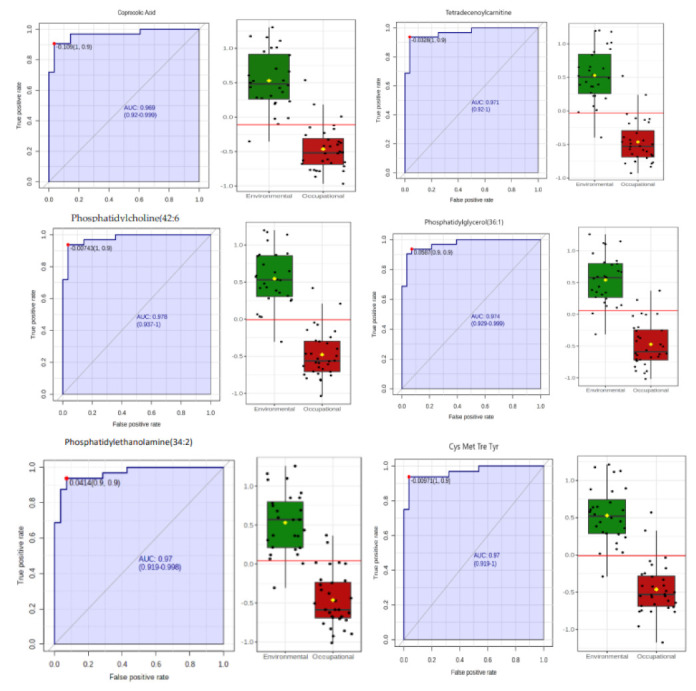
Figure 6.

ROC curves of the discriminating urinary metabolites associated with oxidative stress and chromosomal aberrations induced by exposure to low concentrations of benzene. Note: On the left, the graphical representation of the calculated ROC curve with a 95% confidence interval for each biomarker candidate. AUC = area under the ROC curve. On the right, boxplot of metabolite concentrations in the environmental (green) and occupationally (red) exposed groups. A red horizontal line indicates the optimal cutoff point.
