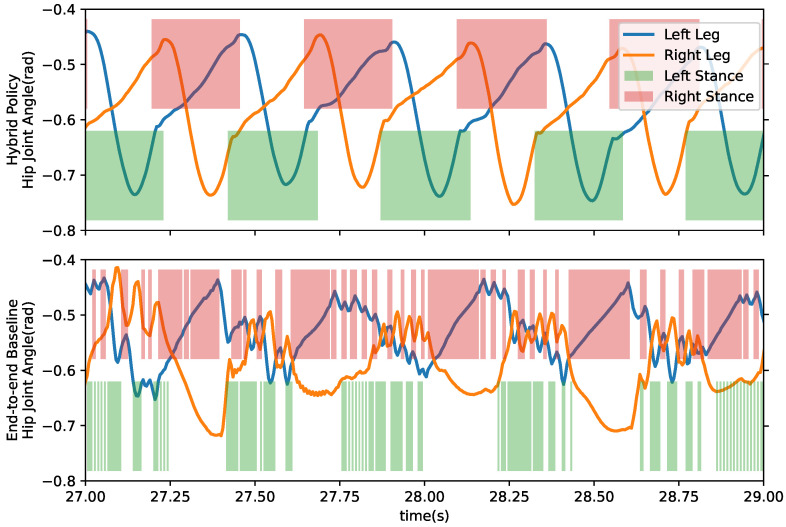
Figure 8.
Plot of hip joint position and contact time series while walking. Colored area refers to the foot is having contact with ground at the time. Upper sub-plot’s data is generated by proposed hybrid method, and lower sub-plot plots end-to-end baseline data. Both trajectories are recorded from the test episode described in Figure 6.

