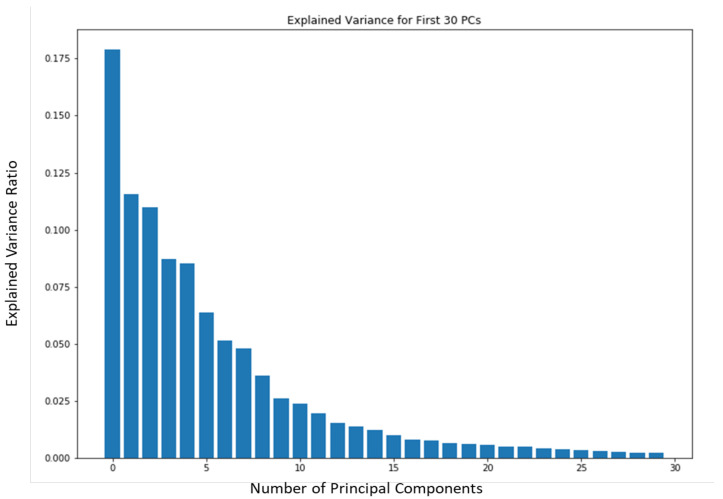
Figure 13.
Scree Plot The Scree Plot shows the stability of ST-DeepGait’s featurization in embedded space by showing the explained variance ratio according to the first principal components from the PCA plot in Figure 8a. Interestingly, the ST-DeepGait model appears to have compressed the complex multivariate spatiotemporal joint feature patterns for gait into approximately the first 15 PCs.

