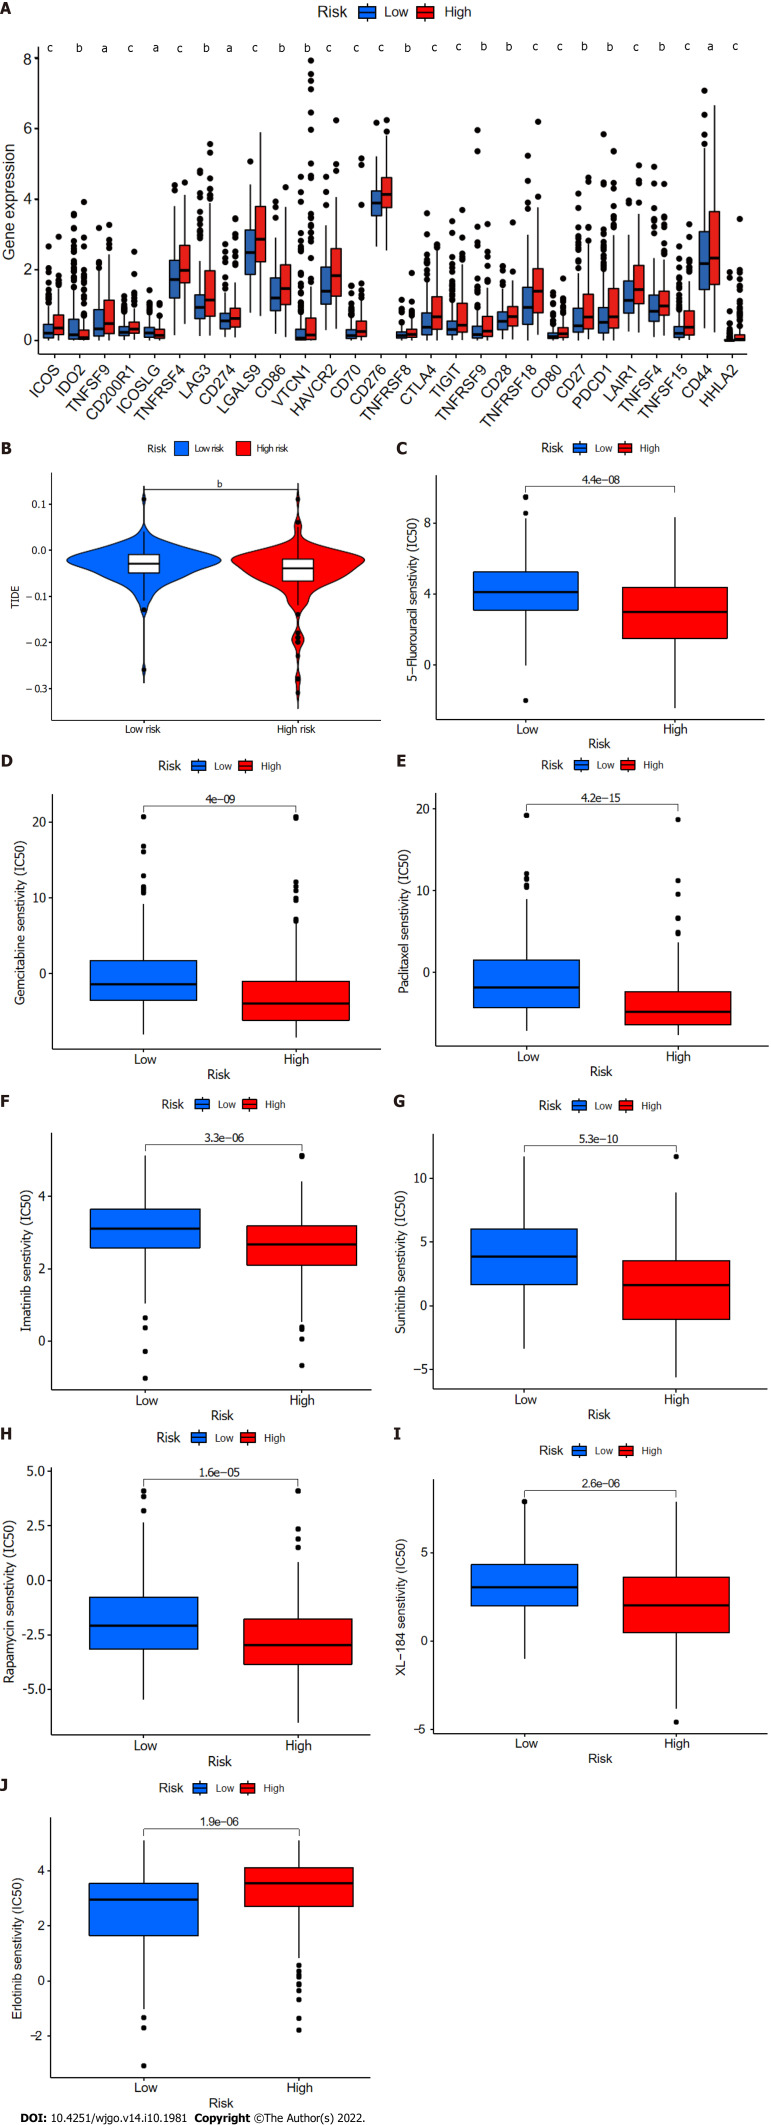
Figure 11.
Comparison of immune checkpoints, tumor immune dysfunction, and exclusion module scores, and chemotherapy and targeted therapy drug efficacy in high- and low-risk groups. A: Expression of 28 immune checkpoint genes differed between the high- and low-risk groups. Red and blue boxes represent high- and low-risk patients, respectively; B: Online software tumor immune dysfunction (TIDE) predictions of outcomes in HCC subgroups treated with either anti-PD1 or anti-CTLA4 therapy. A higher TIDE score suggests a greater likelihood of tumor immune escape and a poorer response to immunotherapy; C-J: IC50 values for (C) 5-fluorouracil, (D) gemcitabine, (E) paclitaxel, (F) imatinib, (G) sunitinib, (H) rapamycin, (I) XL-184 (cabozantinib), and (J) erlotinib in high- and low-risk groups. IC50, half-maximal inhibitory concentration. aP < 0.05; bP < 0.01; cP < 0.001. NS: Not significant.

