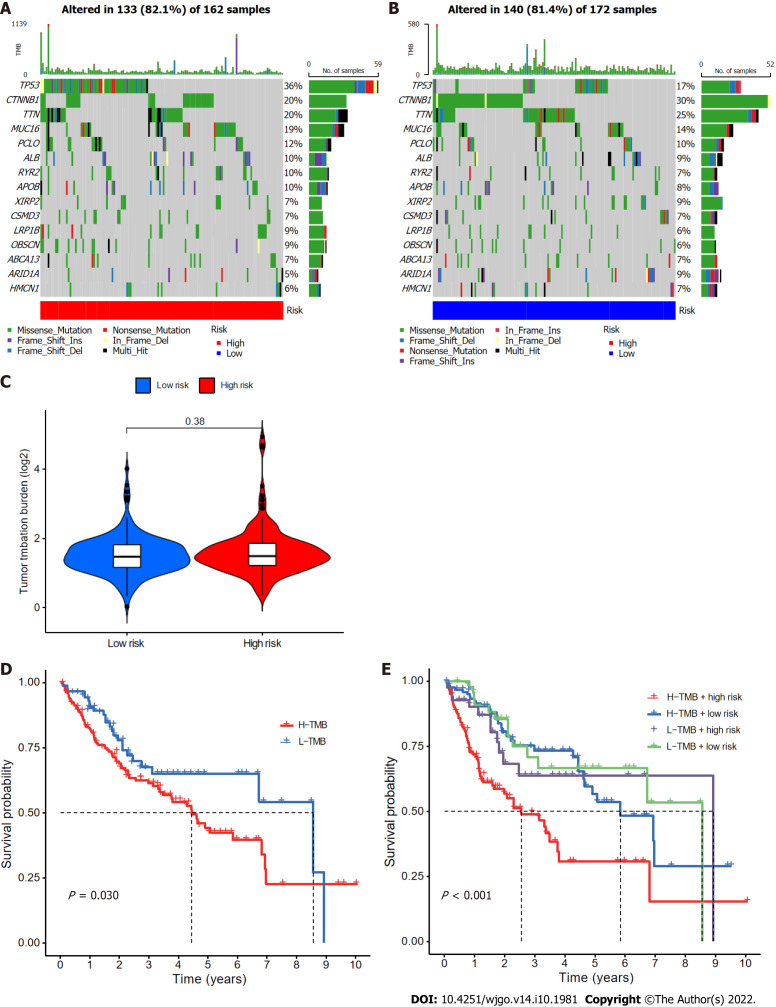
Figure 9.
Relationships between cuproptosis-related long-chain non-coding RNA signature (CupRLSig) risk scores and somatic mutation and tumor mutation burden. A and B: Waterfall plots showing somatic mutations of the most significant 15 genes among high-risk (A) and low-risk (B) hepatocellular carcinoma (HCC) patients; C: Comparison of tumor mutation burden (TMB) between low- and high-risk subgroups; D: Kaplan-Meier curves for high- and low-TMB groups; E: Kaplan-Meier curves for subgroup analyses of patients stratified by TMB and risk score. The P value is representative of the results of the analysis of variance test among subgroups.

