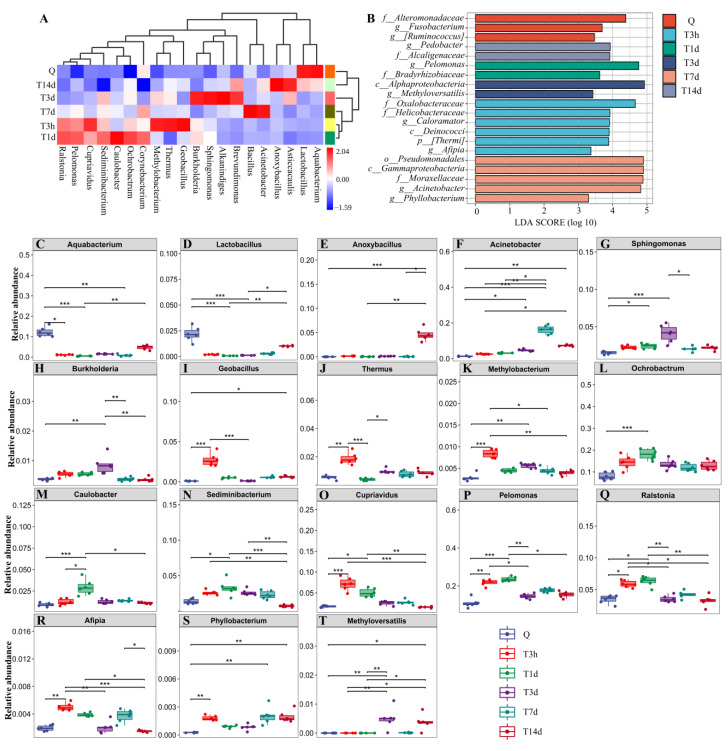
Figure 2.
Species composition analysis of lung microbiota. (A): Heatmap analysis of relative abundances of gut microbiota at the genus level in different groups. (B): LEfSe analysis of lung microbiota. The histogram of the Linear discriminant analysis (LDA) scores illustrates the differentially abundant bacterial communities in the lung microbiota. The LDA score at log 10 > 3 is set as the threshold and the length of each bin, i.e., the LDA score represents the extent to which the bacterial biomarker differs among the groups. (C–T): Relative abundances of 18 significantly altered bacterial genera. Q: control group. T3h, T1d, T3d, T7d and T14d: 3 h, 1 d, 3 d, 7 d and 14 d after sTBI. * p < 0.05; ** p < 0.01; *** p < 0.001.

