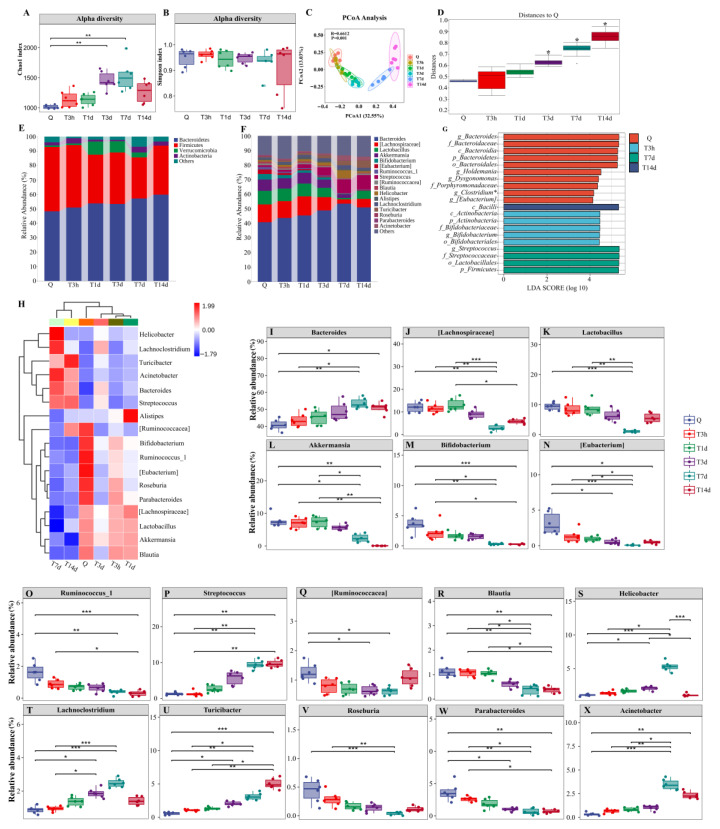
Figure 3.
sTBI induces gut microbiota dysbiosis. (A,B): Analysis of alpha diversity of gut microbiota by Chao1 analysis and Simpson analysis, respectively. (C): PCoA plots of beta diversity in different groups. (D): Analysis of differences between groups based on permutational multivariate analysis of variance. (E,F): Relative abundance of gut microbiota at phylum and genus, respectively. (G): LEfSe analysis of gut microbiota. The histogram of the Linear discriminant analysis (LDA) scores illustrates the differentially abundant bacterial communities in the gut microbiota. The LDA score at log 10 > 3 is set as the threshold and the length of each bin, i.e., the LDA score represents the extent to which the bacterial biomarker differs among the groups. (H): Heatmap analysis of relative abundances of gut microbiota at the genus level in different groups. (I–X): Relative abundances of 16 significantly altered bacterial genera. Q: control group. T3h, T1d, T3d, T7d and T14d: 3 h, 1 d, 3 d, 7 d and 14 d after sTBI. * p < 0.05; ** p < 0.01; *** p < 0.001.

