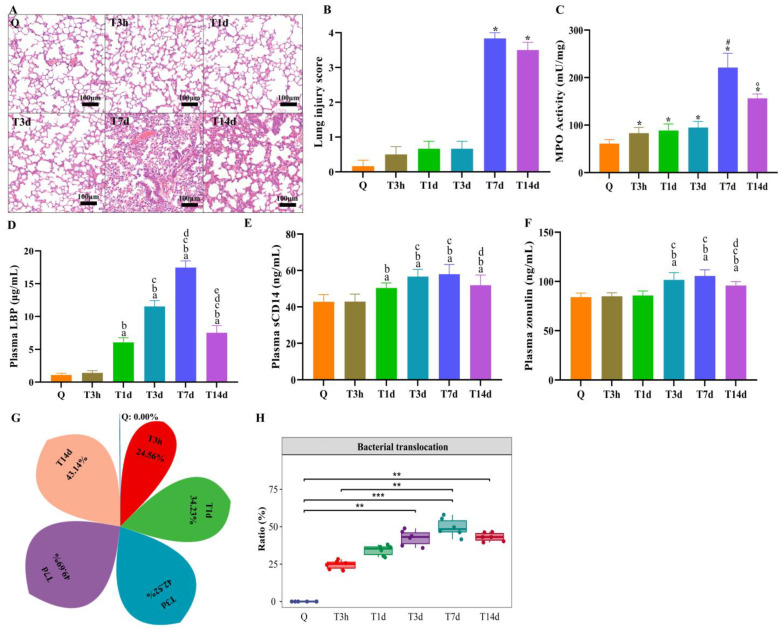
Figure 4.
Lung injury and bacterial translocation and in mice after sTBI. (A): Lung HE staining. Q: control group. T3h, T1d, T3d, T7d and T14d: 3 h, 1 d, 3 d, 7 d and 14 d after sTBI. Scale bar = 100 μm. (B): Quantification of histological injury score. Data are depicted as mean ± SD with * p < 0.05 compared to Q, T3h, T1d, T3d by one-way ANOVA. (C): MPO activity of lung tissue. Q: control group. Data are depicted as mean ± SD with * p < 0.05 compared to Q, #p < 0.05 compared to Q, T3h, T1d, T3d, ° p < 0.05 compared to T7d by one-way ANOVA. (D): Levels of plasma LBP. a p < 0.05 compared to Q, b p < 0.05 compared to T3h, c p < 0.05 compared to T1d, d p < 0.05 compared to T3d, e p < 0.05 compared to T7d by one-way ANOVA. (E): Levels of plasma sCD14. a p < 0.05 compared to Q, b p < 0.05 compared to T3h, c p < 0.05 compared to T1d, d p < 0.05 compared to T7d by one-way ANOVA. (F): Levels of plasma zonulin. a p < 0.05 compared to Q, b p < 0.05 compared to T3h, c p < 0.05 compared to T1d, d p < 0.05 compared to T7d by one-way ANOVA. Q: control group. T3h, T1d, T3d, T7d and T14d: 3 h, 1 d, 3 d, 7 d and 14 d after sTBI. Data are depicted as mean ± SD. (G,H): SourceTracker identified lung microbiota contains bacteria from the gut microbiota. * p < 0.05; ** p < 0.01; *** p < 0.001.

