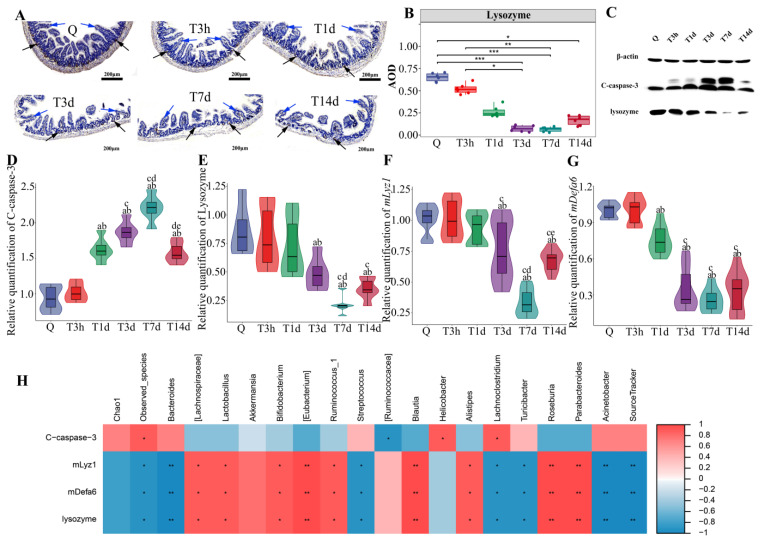
Figure 5.
Paneth cells control gut microbiota and post-sTBI infection. (A): Intestinal lysozyme immunohistochemistry. Q: control group. T3h, T1d, T3d, T7d and T14d: 3 h, 1 d, 3 d, 7 d and 14 d after severe TBI. The black arrow indicated lysozyme. The Blue arrow indicates the villi of the small intestine. Scale bar = 200 μm. (B): The DAB staining intensity. * p < 0.05; ** p < 0.01; *** p < 0.001. (C): Apoptosis and lysozyme expression in the small intestine by Western Blot. C-caspase-3 indicated Cleaved caspase-3. (D): Cleaved caspase-3 at different time points after severe TBI. Data are depicted as mean ± SD with a p < 0.05 compared to Q, b p < 0.05 compared to T3h, c p < 0.05 compared to T1d, d p < 0.05 compared to T3d, e p < 0.05 compared to T7d by one-way ANOVA. (E): Lysozyme at different time points after severe TBI. Data are depicted as mean ± SD with a p < 0.05 compared to Q, b p < 0.05 compared to T3h, c p < 0.05 compared to T1d, d p < 0.05 compared to T3d by one-way ANOVA. (F): mLyz1 at different time points after severe TBI. Data are depicted as mean ± SD with a p < 0.05 compared to Q, b p < 0.05 compared to T3h, c p < 0.05 compared to T1d, d p < 0.05 compared to T3d, e p < 0.05 compared to T7d by one-way ANOVA. (G): mDefa6 at different time points after severe TBI. Data are depicted as mean ± SD with a p < 0.05 compared to Q, b p < 0.05 compared to T3h, c p < 0.05 compared to T1d by one-way ANOVA. (H): The correlation between intestinal apoptosis or antimicrobial peptides and gut dysbacteriosis or bacterial translocation by Spearman rank correlation coefficient. Red indicated a positive correlation. Blue indicated a negative correlation. Color depth indicates the strength of correlation. * p < 0.05; ** p < 0.01; *** p < 0.001.

