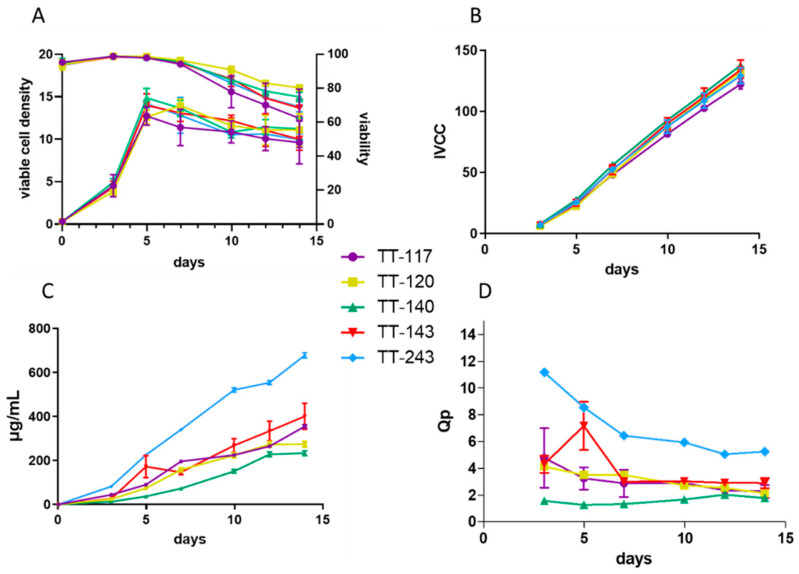
Figure 2.
Graphs of fed-batch cultivation of stable transfection. Pools of mAbs were cultivated in a fed-batch mode for 14 days, with the evaluation of cell density and viability (A), IVCC (B), titer (C), and Qp (D). Each of the five mAbs is identified by the same color line. Graphs A and B, related to cell growth, show the mean and SD of data obtained by the four conditions of the selection agents for each mAb. Graphs (C,D), related to mAb production, show the quadruplicate of titers measured in the most stringent selection step.

