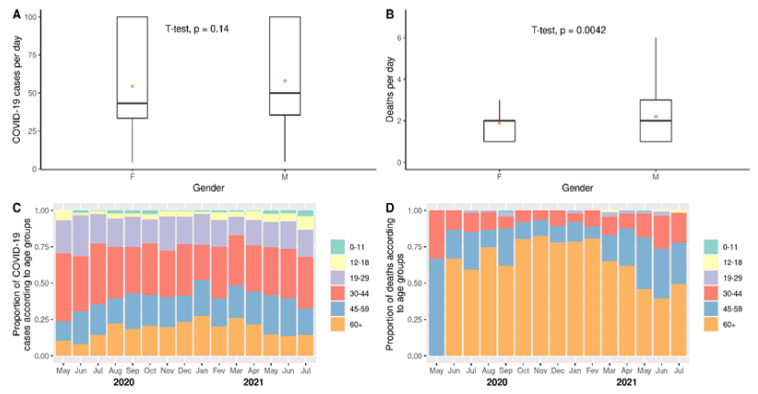
Figure 2.
Impact of COVID-19 according to gender or age. Comparisons of numbers of cases per day (A) and numbers of deaths per day (B) considering the whole period of study were carried out based on Student’s t-test. Significance was set as p ≤ 0.05. In addition, proportions of cases (C) and deaths (D) according to age groups were computed. Dots represent means. Horizontal bars represent medians.

