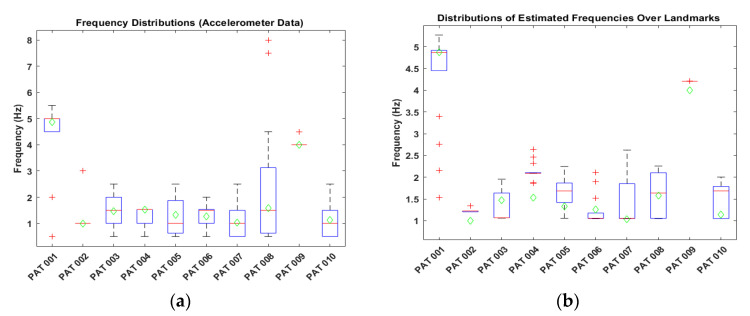
Figure 5.
Frequency distributions. (a) Distribution of the accelerometer signals (15 frequency calculations were used for each patient). (b) Distribution of the video data over all landmarks (frequency calculations of 21 landmarks were used for each patient). Green diamonds correspond to the accelerometer’s calculated dominant frequency.

