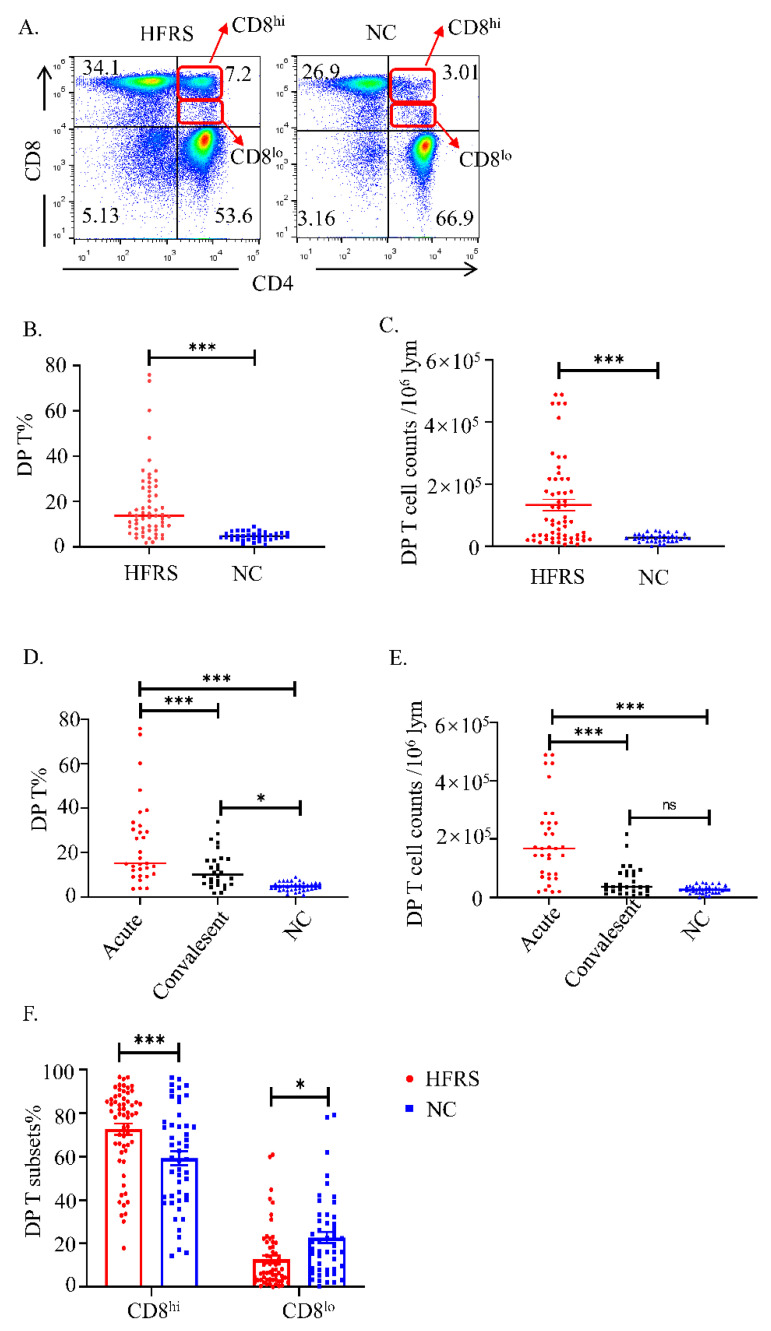
Figure 1.
The kinetic changes of DP T cells in HFRS patients. (A). The representative flow cytometric plots of DP T cells in both HFRS patients and normal controls (NC). The gradually changing of the dots ‘colors indicated the cell density. The red color indicated the high cell density, while the blue color indicated the low cell density. Summary data of the comparison of the (B) percentage and (C) cell counts of DP T cells in HFRS patients and NC. Summary data of the comparison of the (D) percentage and (E) cell counts of DP T cells in different phases (acute phase and convalescent phase) of HFRS patients and NC. (F) The comparison of CD8hi and CD8lo subsets of DP T cells in HFRS patients and NC (For HFRS, n = 59; For NC, n = 36). * p < 0.05; *** p < 0.001.

