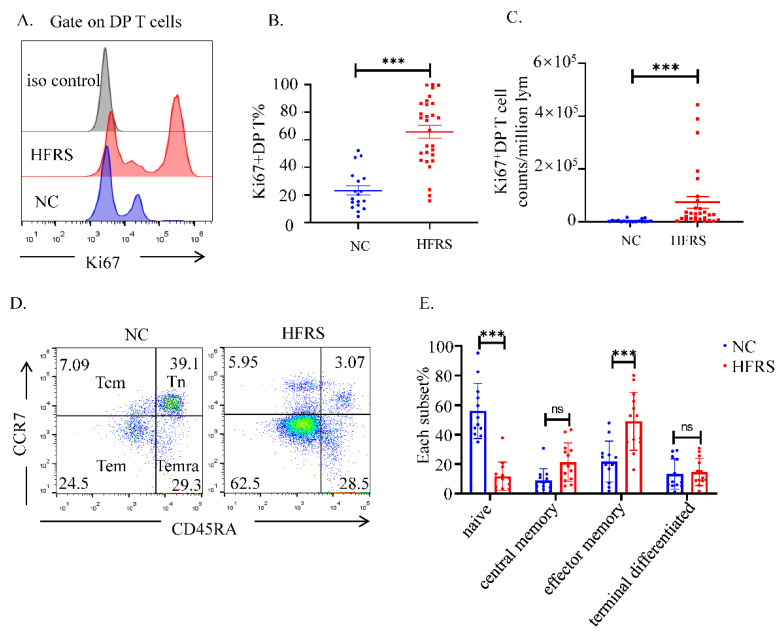
Figure 3.
The activation status of DP T cells. (A). The expression of Ki67 in DP T cells was evaluated by flow cytometry. The representative histogram figures of Ki67 expression in DP T cells from both HFRS patients and NC, setting iso type staining as controls. (B) Comparison the percentage of Ki67+DP T cells and the (C) MFI of Ki67 in DP T cells from both HFRS patients and NC (For HFRS, n = 29, For NC, n = 18). (D) T cell subsets are defined as naïve (Tn) (CD45RA+, CCR7+), central memory (Tcm) (CD45RA−, CCR7+), effector memory (Tem) (CD45RA−, CCR7−), and terminal effectors (Temra) (CD45RA+, CCR7−). The representative dot blot figures showed the activation status of T cell subsets in DP T cells. (E) The statistical analysis showed the comparison of each T cell subset in both HFRS patients and NC (For HFRS, n = 13. For NC, n = 12). *** p < 0.001; “ns” means no significance.

