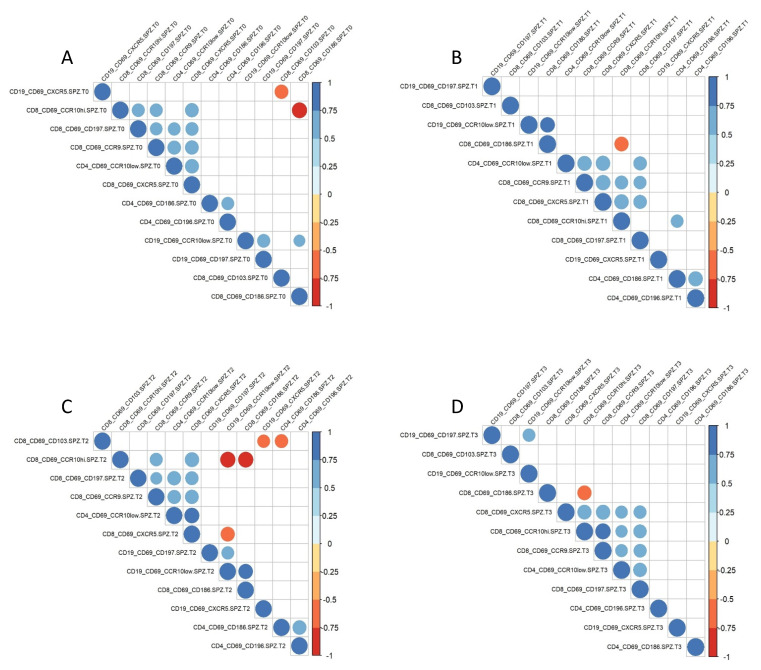
Figure 4.
Homing receptor profiles induced by RAS vaccination. The relationship between expressed homing receptors on SPZ-specific lymphocytes was investigated by generating a correlation matrix including only homing receptors with significant altered expression after immunization or challenge. (A) Correlation matrix of these 12 parameters before immunization (T0); (B) after immunization (T1); (C) 5–6 days after CHMI (T2); (D) 3–4 months after CHMI (T3). Only significant correlations (p < 0.05) are shown. The color and size of the dots (scale next to graph) indicate the degree of correlation between the different parameters (small to large indicating low to high correlation).

